

Abstract
We demonstrate a master oscillator power amplifier system that emits single-frequency, high-energy optical pulses at 1539 nm using an Er, Yb:glass planar waveguide amplifier with a normalized frequency of the waveguide of 4.4. A maximum pulse energy of 9.7 mJ is observed at a repetition frequency of 500 Hz. The signal to noise ratio is 25 dB and is independent of the repetition frequency from 100 to 500 Hz. The beam quality factor M2 of the output is 1.03 thanks to the small normalized frequency of the planar waveguide.
Export citation and abstract BibTeX RIS

Content from this work may be used under the terms of the Creative Commons Attribution 4.0 license. Any further distribution of this work must maintain attribution to the author(s) and the title of the work, journal citation and DOI.
High-power amplifiers at 1.5 μm have been demonstrated to be powerful tools, not only for light detection and ranging (lidar), 1,2) but also for gravitational wave detection, 3) frequency metrology, 4) atmospheric sensing, 5) and optical time domain reflectometry. 6) In particular, pulses with a high energy (>1 mJ), a long pulse duration (>100 ns), a single frequency and good beam quality (M2 < 2) are required in the research field of coherent Doppler wind lidars (CDWLs). 7–25) Several groups have developed master oscillator power amplifier (MOPA) systems using an Er, Yb: co-doped fiber amplifier 10–16) or an Er-doped fiber amplifier (EDFA) 17–23) with a large mode area (LMA) to avoid stimulated Brillouin scattering (SBS) and laser induced damage (LID). Most work on all-fiber MOPA systems has been demonstrated with pulse energies of up to 1.5 mJ due to SBS or amplified spontaneous emission (ASE) dynamics. Enlarging the mode field diameter (MFD) of the fiber with higher density pumping enables higher pulse energies of up to 2 mJ, while degrading the signal to noise ratio (SNR) and the beam quality. 14,16)
Planar waveguide amplifiers (PWAs) made of Er, Yb:glass enable us to obtain higher pulse energies. 24,25) Good heat dissipation due to plane-to-plane bonding between the PWA and a heat sink enables high density pumping and avoids thermal lensing. A planar waveguide structure can suppress the degradation of the beam quality associated with the expansion of the mode field area compared to a two-dimensional waveguide. Moreover, a multi-bounce optical path configuration is employed to obtain high small signal gain. CDWL measurements over 30 km have been demonstrated using a PWA which emits 3.2 mJ pulses with a M2 of 1.3 at 4 kHz. 24) 45.2 mJ pulses at 150 Hz have also been demonstrated using an improved large PWA as the main amplifier and an LMA EDFA as the preamplifier 25) for space-borne mission. 25–27) A symmetrical double under-cladding structure with a 50 μm core was employed to increase the volume of the PWA's active area and to mitigate the possibility of LID. An LMA EDFA 20,23) was introduced to increase the energy of the input pulses significantly over that of a single-mode EDFA. In this case, limiting of the energy and degradation of the SNR to 18 dB were observed due to parasitic oscillations in the large PWA when using high density pumping. One way to suppress parasitic oscillations in the large PWA and to obtain higher pulse energy and better SNR is to increase the input signal energy and reduce the required gain of this PWA. 25,26) In this case, a higher-energy preamplifier than an LMA EDFA with a good SNR prevents unwanted light in the input beam to the main amplifier reducing its net signal gain. In addition, good beam quality of the preamplifier is also required. This is not only since the coupling efficiency to the main amplifier depends on input beam quality, but also since it affects the output beam quality of the main amplifier (PWA) in the free-space propagation direction. No PWAs with SNR and beam quality comparable to LMA amplifiers have been reported. 24,25)
In this paper, we have demonstrated a single-frequency high-energy MOPA system using a double under-cladding PWA with a small relative refractive index difference between the 25 μm core and the 1st cladding. A maximum pulse energy of 9.7 mJ is achieved with a repetition frequency (frep) of 500 Hz. The SNR of 25 dB is obtained, as well as exhibiting an M2 of 1.03. The figure of merit (FoM) as a light source for CDWL is 105 mJ√Hz, which is 1.6 times larger than previous results for LMA EDFAs or LMA EYDFAs.
Figure 1 shows the experimental setup. Transform-limited signal pulses are generated from a seed pulse laser which consists of a distributed feedback fiber laser with a typical linewidth of 100 kHz and frequency stability below 150 MHz, and a pulse modulator. The pulses are amplified by a commercial EDFA module consisting of a pump Laser diode (LD), a single-mode EDF and a narrow bandpass filter (BPF) with a bandwidth of 1 nm (not shown in Fig. 1). The pulse energy is 44 μJ and the SNR is 28 dB at a resolution bandwidth (RBW) of 0.07 nm and a video bandwidth (VBW) of 10 Hz. The SNR of the input beam is limited by the characteristics of the BPF in the module. In this measurement, the pulse energy variation is less than 10% and the SNR variation is less than 2.5 dB when the frep varied from 100 to 500 Hz. The typical pulse duration is 890 ns. The amplified signal pulses are collimated by a collimating lens. An isolator is used to prevent unwanted back scattered light. The input beam is focused on the input window of the PWA by a cylindrical lens and thence coupled into the PWA. The inset shows the double clad Er, Yb:glass PWA. 25) The anti-reflection (AR) coated input and output windows are shown as blue lines. The input beam propagates in a zigzag between two highly-reflective (HR) coated facets shown as green line. The output beam exits from the output window which sits opposite to the input window. The other two sides of the PWA shown as red lines are polished and coated with an AR coating effective at 940 nm for the pump beams. A total of 28 pigtail LDs is used for pumping. The peak power of LD is 10 W at 12 A. Two fiber arrays of 14 fibers are bundled and close to the PWA to input pump beams. The pump beams propagate in the double clad waveguide on a single pass. Since we have already had knowledge of the effect of the pump pulse width on the output ASE characteristics of amplifiers, 23) we maintain all the pulse pump widths at 1.0 ms when the frep is changed. The total maximum pumping energy for the PWA is 289 mJ. The double-clad waveguide consists of an Er,Yb:phosphate glass core, a non-doped phosphate glass layers (1st cladding), and an optical glass layers (2nd cladding). The PWA is attached to a water-cooled copper heat sink. The size of the waveguide is 23 mm × 30 mm × 8 mm. The thickness of the core is 25 μm. The normalized frequency (V number) 28) of the waveguide is 4.4 and allows the propagation of up to the TM02 mode in the PWA. To obtain enough small signal gain, the propagation length considering refractive index is increased to 1.1 m.
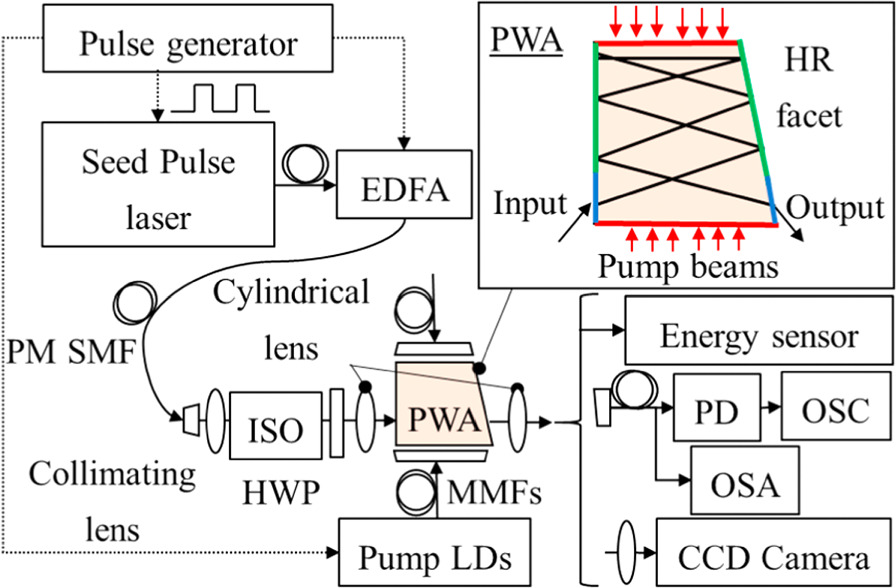
Fig. 1. Schematic diagram of the experimental setup. EDFA: Er-doped fiber amplifier; PM SMF: polarization maintained single mode fiber; ISO: optical isolator; HWP: half-wave plate; PWA: planar waveguide amplifier; pump LDs: laser diode array for pumping the PWA; PD: photodetector; OSC: oscilloscope; OSA: optical spectrum analyzer; CCD camera: charge coupled device camera. The optical and electrical paths are shown as solid and dashed lines, respectively. The inset shows the schematic of the PWA. The windows with an anti-reflection (AR) coating and the faces with a highly-reflective (HR) coating are shown in green and blue, respectively.
Download figure:
Standard image High-resolution imageThe amplified output beam exited from the output window of the PWA and is collimated by another cylindrical lens. The pulse energy of the output is measured by a pyroelectric energy sensor. The pulse shape is observed by using a photodetector and oscilloscope. The output spectra are measured by an optical spectrum analyzer. The beam quality is measured using a CCD camera with a plano-convex lens (f = 350 mm).
Figure 2(a) shows the measured output energy of the PWA with an frep of 100 Hz (black squares), 150 Hz (green triangles), 300 Hz (blue diamonds), and 500 Hz (red circles). At 500 Hz, the maximum signal pulse energy reaches 9.7 mJ at the pump energy of 289 mJ, and the gain is 23 dB. The output energy continues to increase as the pump energy increases and the maximum pump energy is limited by the maximum available pump energy. We think that the deterioration of slope over 9 mJ occurs because the ASE generated by parasitic oscillations due to high-density pumping saps the gain of the PWA. At other values of frep, the maximum output energies are 9.0 mJ (300 Hz), 4.3 mJ (150 Hz) and 1.9 mJ (100 Hz), respectively. The maximum output energy is seen to decrease as the frep decreases. At the level of several hundred Hz, the lower the frep, the more excited Er ions are reduced in the off-period due to their upper level lifetime. 29) For the same pump energy, the excitation rate of the Er ions in the pulse pumped PWA immediately before the signal input is considered to deteriorate as frep decreases. 12) Comparing the measurements at the same frep (150 Hz), the pump energy required to achieve the same output energy is less than in the previous study. 25) This is due to the smaller volume of the active region of the PWA and increases with the number of propagation passes in the PWA.
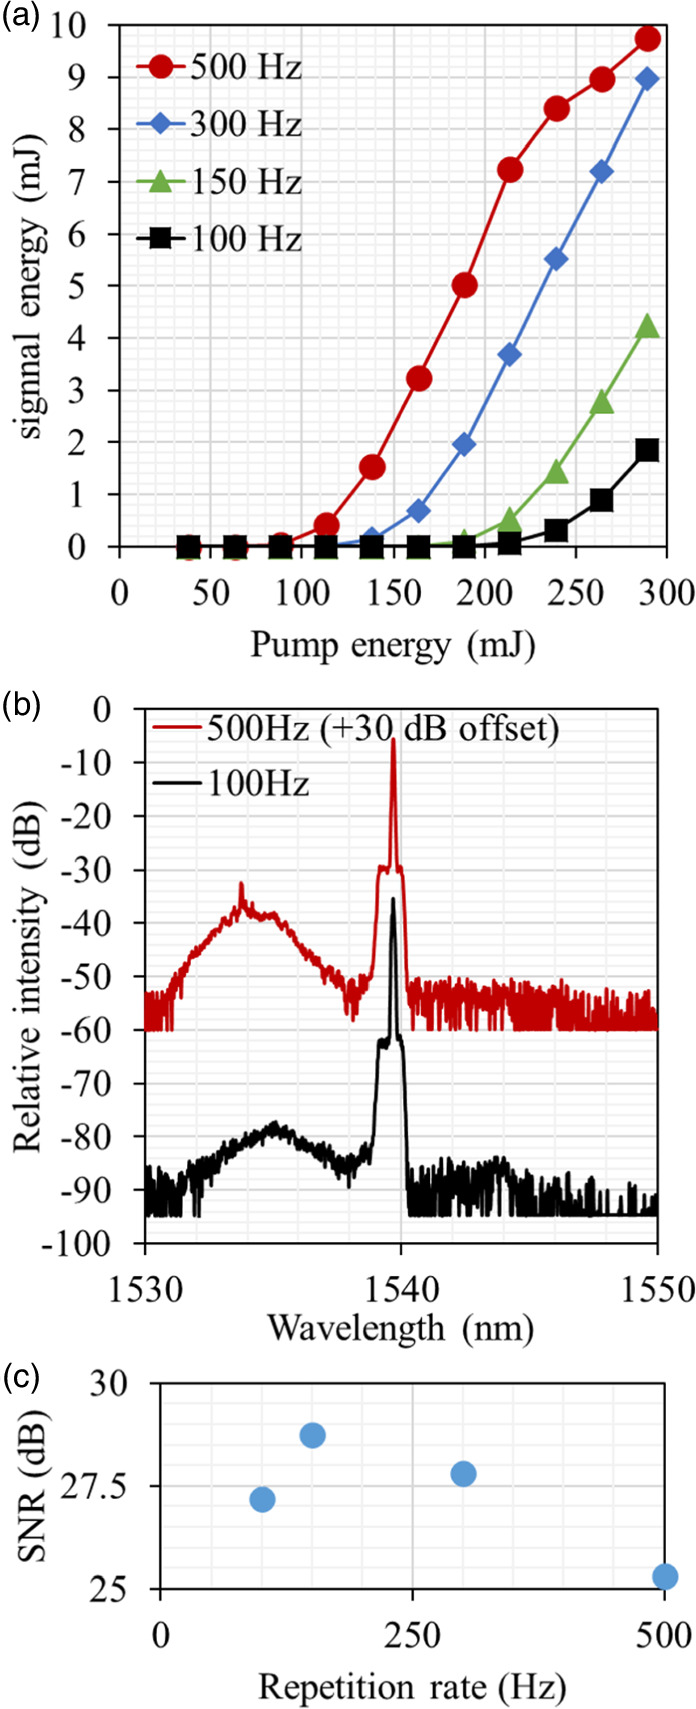
Fig. 2. (a) Measured output pulse energy against pump energy with frep of 100 Hz (black squares), 150 Hz (green triangles), 300 Hz (blue diamonds) and 500 Hz (red circles). (b) Measured output spectra with frep of 100 Hz (black curve) and 500 Hz (red curve, +30 dB offset). The RBW and VBW are 0.07 nm and 10 Hz, respectively. (c) Calculated SNR from the measured spectra with the frep from 100 Hz to 500 Hz.
Download figure:
Standard image High-resolution imageFigure 2(b) shows the measured output spectra of the PWA with pulse energies of 1.9 mJ at 100 Hz (black curve) and 9.7 mJ at 500 Hz (red curve). The peak wavelength at 1539 nm corresponds to the signal, and the others are ASE. The main peak wavelength of the ASE is at 1534 nm, and the several smaller spikes at 500 Hz indicate the existence of parasitic oscillations in the PWA. The high intensity pumping causes a large population inversion and generates a large gain at 1534 nm compared to another wavelength region. The SNRs of the spectra around 1539 nm are 25.3 dB for 500 Hz and 27.2 dB for 100 Hz. In all measurements, the SNRs are limited not by the newly generated ASE in the PWA at 1534 nm, but by the 1 nm pedestal width near the signal wavelength due to the BPF built into the EDFA module. The relative ASE level at 1534 nm is lower at 100 Hz compared to 500 Hz. As mentioned for Fig. 2(a), we believe that the higher frep reduces the effect of decay due to the upper-level lifetime of the Er ions and increases the excitation ratio of the Er ions immediately before the signal input in the PWA, which in turn increases the amount of ASE generated in the PWA immediately before the signal input. The SNR for each repetition frequency is shown Fig. 2(c). The difference in SNR at each frep is due to the variation of the SNR of the input pulse.
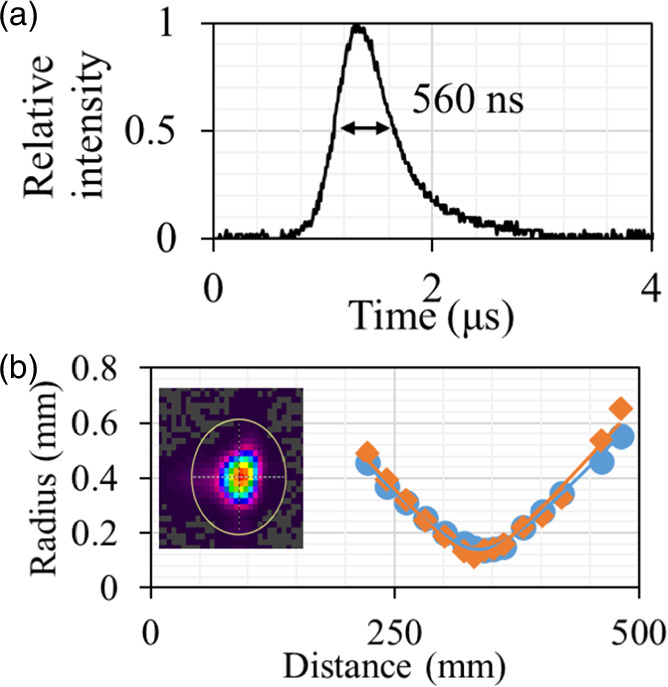
Figure 3(a) shows the measured time waveform of the output from the PWA with the output energy of 9.7 mJ at 500 Hz. The pulse duration is 560 ns, which corresponds to 17 kW peak power without any indication of SBS and LID in the PWA. This peak power is less than half of the damage threshold of the AR coated output window. Unlike the result shown in our previous study, 25) no ASE generated immediately before the signal pulse is observed. It is estimated that this ASE is below the detection limit of our measurement system. Significant differences for time waveform are not observed for each frep.
Fig. 3. (a) Measured time waveform with frep of 500 Hz. (c) Measured beam quality. The circles and diamonds indicate beam radius versus distance from the focusing lens in the X and Y directions. The solid curves are the fitted curves for each direction, respectively. The inset shows the beam pattern at a distance of 350 mm from the lens.
Download figure:
Standard image High-resolution image
Figure 3(b) shows the beam radius (1/e2) versus distance from the focusing lens at 9.7 mJ output. X corresponds to the horizontal direction (parallel to the layers), and Y corresponds to the vertical direction (perpendicular to the layers). The beam quality factor M2 is calculated as 1.00 for the horizontal direction and 1.06 for the vertical direction. The geometric mean of the horizontal and vertical M2 is 1.03 (=√(1.00 × 1.06)). The inset picture shows the beam pattern captured by the CCD camera around the focal point. Since the input beam is emitted from the single-mode EDFA and the planar waveguide is designed with a small normalized frequency, better beam quality is obtained compared to our previous studies. 24,25) An uncertainty of this beam quality measurement is not evaluated.
The performance of the MOPA system is expressed below using the formula for CDWL 11)

where E is the pulse energy. The performance of this MOPA system is compared with the previous works 20,21,24,25) in Table I. The Modified FoM is 105 mJ√Hz and is 1.6 times larger than the highest value in previous studies for LMA EDFA. 21) The SNR is slightly lower than that of previously studies for LMA amplifiers. As already mentioned, this is mainly limited by the residual ASE from the EDFA module, not the newly generated ASE in the PWA. It can be improved by using an EDFA with better SNR or by inserting a pulse modulator between the EDFA module and the PWA to remove the ASE generated immediately before the signal pulse as used in previous study. 25)
Table I. Comparison of the performance of the MOPA system in this paper with previous studies.
| References | 20 | 21 | 24 | 25 | This paper |
|---|---|---|---|---|---|
| Main amplifier | LMA EDFA | LMA EDFA | PWA | PWA | PWA |
| Preamplifier | EDFA | EDFA | EDFA | LMA EDFA | EDFA |
| Pulse energy (mJ) | 0.54 | 1.3 | 3.2 | 45.2 | 9.7 |
| Repetition frequency frep (kHz) | 7.2 | 18 | 4 | 0.150 | 0.5 |
| Beam quality factor M2 | 1.12 | 1.25 | 1.29 | 1.84 | 1.03 |
| SNR (dB) | 27 | 30 | 18 | 18 | 25 |
Modified FoM (mJ ) ) | 20 | 68 | 76 | 126 | 105 |
In conclusion, we have developed a single-frequency, high-energy-pulse MOPA system at 1.5 μm using an Er, Yb:glass PWA with good beam quality. A pulse energy of 9.7 mJ is achieved at frep of 500 Hz, and the peak pulse power is over 17 kW. The SNR is 25 dB and beam quality factor M2 is 1.03. The FoM for CDWL reaches 105 mJ√Hz. This PWA could therefore be a good candidate for the preamplifier of a large planar waveguide amplifier 25) toward very long-distance CDWL including space-born missions 27) thanks to its good SNR and beam quality. We think that this MOPA system could be useful for the amplification of narrow-linewidth CW lasers 3) or for high frep. 30) This MOPA system emitting high-energy, single-frequency pulses at 1.5 μm will be useful for a range of applications including sensing and optical space communications.
Acknowledgments
The authors thank Y. Kono for technical assistance. This work is supported by JST, ACT-X Grant No. JPMJAX22KC, Japan.