

Applying a Holistic Approach to Environmental Flow Assessment in the Yen River Basin
by
 ,
,
Tuan Phuc Tong
1,
Son Thanh Hoang
1,
Dung Quang Bui
1,
Ngoc Trong Ha
2,
Linh Ha Nguyen
3,
Lan Minh Nguyen
4 and
Chau Kim Tran
5,* 1
Institute of Geography, Vietnam Academy of Science and Technology, 18 Hoang Quoc Viet, Cau Giay, Hanoi 100000, Vietnam
2
Department of Environment, Ministry of Natural Resources and Environment, 10 Ton That Thuyet, Cau Giay, Hanoi 100000, Vietnam
3
Environment Faculty, Hanoi University of Natural Resources and Environment, 41 A Phu Dien, North-Tu Liem, Hanoi 100000, Vietnam
4
Center for Water Resources Quality and Protection, 93/95 Vu Xuan Thieu, Long Bien, Hanoi 100000, Vietnam
5
Water Engineering Faculty, Thuyloi University, 175 Tay Son, Dong Da, Hanoi 100000, Vietnam
*
Author to whom correspondence should be addressed.
Water 2024, 16(8), 1174; https://doi.org/10.3390/w16081174
Submission received: 17 March 2024
/
Revised: 15 April 2024
/
Accepted: 18 April 2024
/
Published: 20 April 2024
(This article belongs to the Topic Advances in Environmental Hydraulics)
Abstract
:Environmental flow assessment is an essential tool in water resource management. This study employs a holistic approach to evaluate the environmental flow in the Yen Basin, Thanh Hoa, Vietnam. Based on information gathered from a field survey, the Yen River system is divided into five reaches, and environmental objectives and ecological assets are identified in each reach. Hydrological and hydraulic mathematical models are applied to simulate the flow regime in the river, demonstrating their potential to assess environmental flow, especially in basins with limited data. The detailed results from the mathematical model facilitate selecting environmental flow components to address specific objectives for each river reach. By analyzing and selecting the flow regime, this study aims to ensure environmental protection while also considering basin development requirements, laying the groundwork for defining prescribed flow regimes in basin water management.
1. Introduction
Water resource management around the world has been under a lot of strain recently due to the world’s rapid socio-economic development and the growing need to preserve ecosystems. When it comes to ungauged basins, these difficulties increase greatly. The entire ecosystem may suffer from decreased river flows. An approach to reducing this issue will, therefore, be to quantify environmental flows on river systems. Environmental flows describe the quantity, timing, and quality of water flows required to sustain freshwater and estuarine ecosystems and human livelihoods and well-being that depend on these ecosystems [1]. In the last two decades, environmental flows have been increasingly recognized as a vital contributor to the continuing provision of environmental goods and services upon which people’s lives and livelihoods depend [2]. Assessing the impact of human activities on the hydrological regime can be used to develop management strategies for maintaining or restoring environmental flows in rivers and streams [3].
In Vietnam, environmental flow is becoming an increasingly pressing issue and is essential for the planning of water resources, the establishment of reservoir operating procedures, and the planning of water allocation in river basins. In 2017, the Ministry of Natural Resources and Environment issued Circular 64/2017/TT-BTNMT [4] to regulate the determination of the minimum flow on rivers and streams downstream of reservoirs and dams. However, this method provides a single minimum flow value that is applicable throughout the year, which is intended to protect only the essential ecosystem functions necessary for the normal development of aquatic ecosystems. Consequently, a more comprehensive approach is necessary to ensure the sustainable development of the ecosystem, which requires environmental flows that protect a wider range of ecological functions and goals. This must be a flow regime rather than a single flow value.
The management of water resources in specific basins requires the utilization of various approaches for evaluating environmental flows. These methods can be classified into four categories, namely Hydrological Index Methodologies, Hydraulic Rating Methodologies, Habitat Simulation Methodologies, and Holistic methodologies [5,6]. Hydrological Index Methodologies often assume that the ecosystem will suffer if the flow rate decreases below a critical value. The critical value can be determined based on historical flow to estimate the appropriate rate. The popular methods that belong to this category are the Montana Method [7], Range of Variability Approach [8], and Indicators of Hydrologic Alteration (HIA) [9]. The second category is Hydraulic Rating Methodologies, which use hydraulic characteristics such as river width, average depth, flow velocity, wetted parameter, and hydraulic radius to define the environmental flow. The widely accepted method for this category is the Wetted Perimeter Method [10]. Another category is Habitat Simulation Methodologies, which is a more complex way to compute environmental flow. This approach develops a relationship between the stream flow and the habitat requirements of aquatic organisms in a certain living period. The method most representative of this classification is the Instream Flow Incremental Methodology [11]. Currently, Holistic Methodologies have gained prominence as a means of evaluating environmental flows. For most rivers today, there is a conflict between environmental protection and water demands. Finding a solution that balances opposing goals is necessary. These methodologies involve a comprehensive assessment of river systems at a more detailed scale, considering all significant abiotic and biotic components that constitute the ecosystem. This ensures that the full spectrum of flows and their temporal and spatial variability are considered. In addition, the methodologies also take into account issues related to water use needs on the river. This is the outstanding advantage of these methodologies compared to the methodologies mentioned above. For example, Gippel et al. (2009) [3] provided a generic approach for environmental flow assessment. Kinga et al. (1998) [12] developed the Building Block Methodology (BBM) to estimate the environmental flow in Victoria, Australia. As the methods become more complex, the time, resources, and capabilities required to conduct the assessment also increase, but so does the level of confidence in the ability of the flow regime to support system values. Furthermore, holistic methods often extend beyond ecosystem values to include social values and ecosystem goods and services associated with specific flow regimes. Globally, these methods are increasingly being recognized as the standard approach for assessing the environmental flow of rivers. Despite various detailed assessment methods developed in different regions and countries, many of these holistic methods share common characteristics, which are to combine several hydrological, hydraulic, and habitat analysis tools that exist in simpler environmental flow methods.
Most studies on environmental flows focus on freshwater, with a scarcity of studies in estuary areas [3]. In this area, the flow is influenced by both river currents and tides, resulting in an exceedingly intricate hydraulic regime. The direction of flow can switch between towards the sea (positive flow) and towards the river (negative flow). This presents a significant obstacle when attempting to establish the environmental flow. In addition to the complexity of the hydraulic regime, seawater intrusion is an important factor in the spatial and temporal distribution of an estuary ecosystem [13]. Therefore, researching how to assess environmental flows in estuaries is urgently required to fill the existing gap.
The purpose of this research is to determine the environmental flow required for sustainable development in the Yen River basin. To accomplish this, the research consists of three phases, specifically: (1) develop hydrological and hydraulic models to simulate hydrological and water quality data for data limitations in the basin, (2) divide the river system into functionally similar segments using a comprehensive approach, and (3) identify the environmental flow components for each segment. The main research outcome contributes to a better understanding of the ecohydrological contexts of the Yen River. It intends not only to protect a greater range of ecological assets but also to be a part of basin planning processes.
2. Materials and Methods
2.1. Research Area
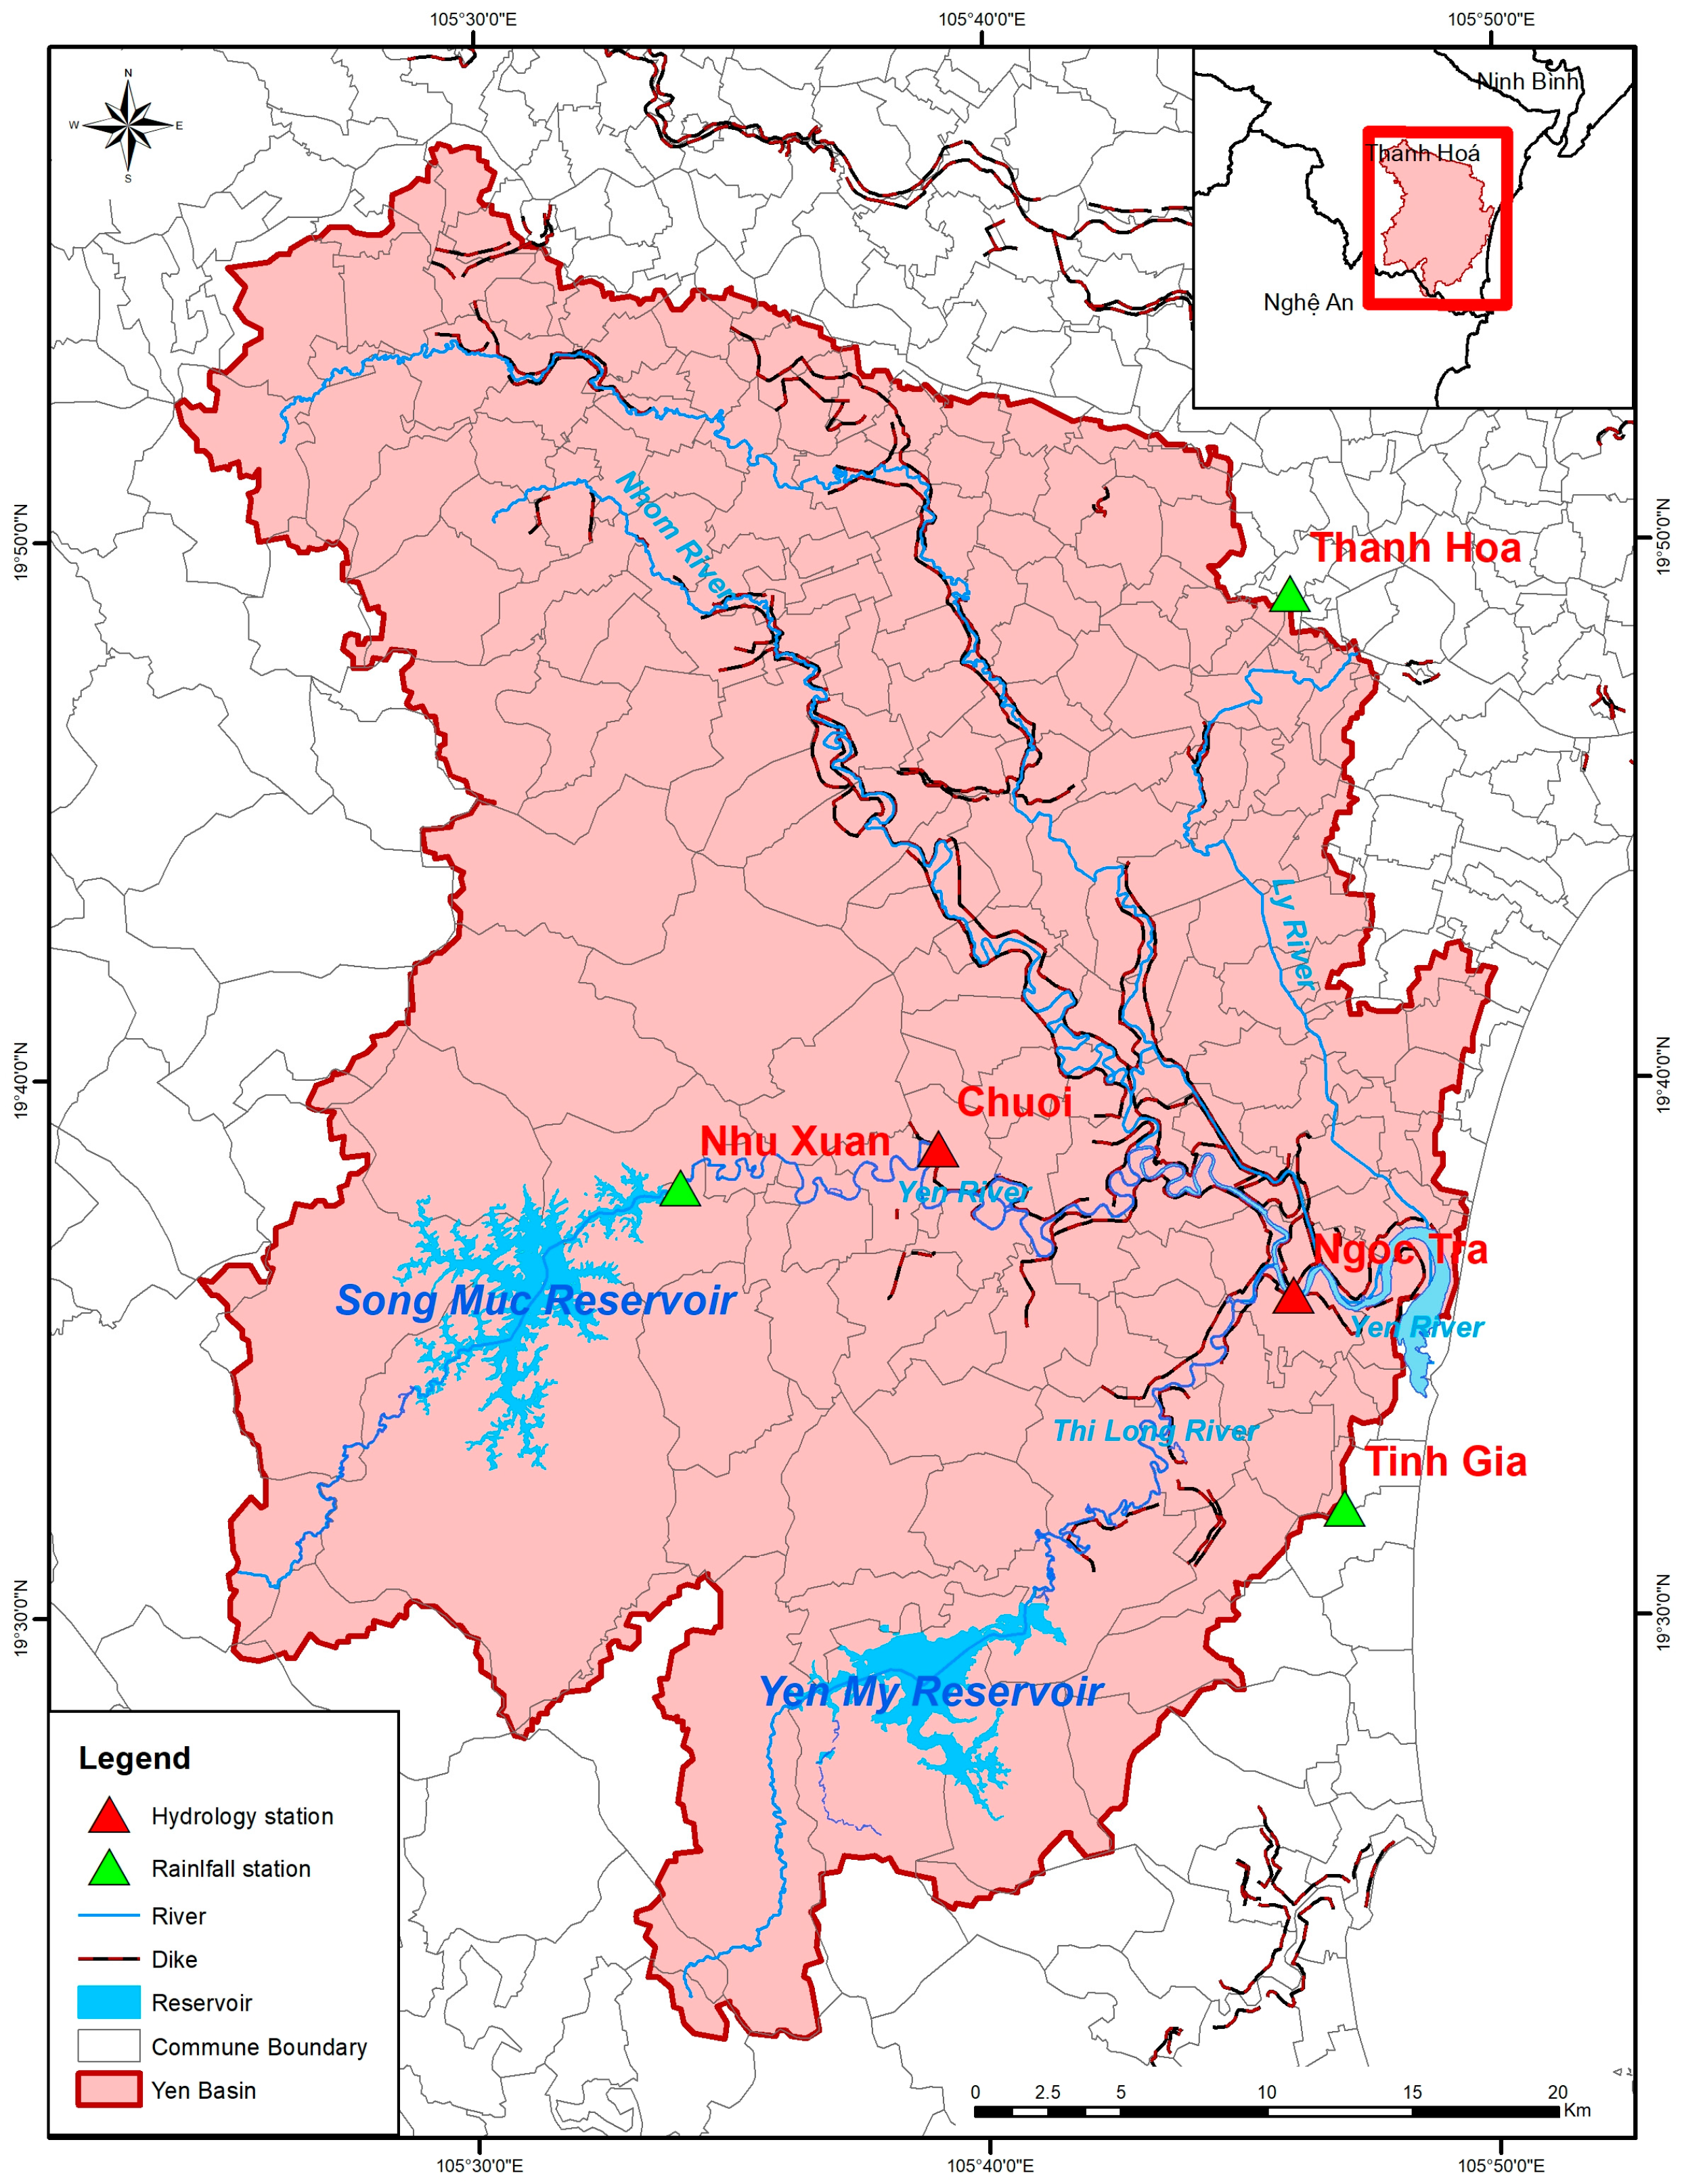
The research area is the Yen River basin in Thanh Hoa province, Vietnam. This basin spans a total of 1996 square kilometers and is characterized by a distribution of mountain forests covering 45.2% of the area, while plains and semi-mountainous regions account for 49.5% of the total. According to Vietnamese standard TCVN 13615 [14], the primary stream within this basin is the Yen River, which originates in the high mountains of Binh Yen commune and flows out to the sea. The Yen River is accompanied by eight tributaries, and the network of rivers and streams within the basin is illustrated in Figure 1 and Table 1.
The largest tributary in this river system is Thi Long River. Figure 1 presents the river network in the basin. A significant issue facing the Yen River basin is salt intrusion. During the dry season, which lasts from December to June, the area is heavily impacted by tidal fluctuations and the encroachment of salt intrusion. This is due to a decline in rainfall, resulting in a reduced flow and water level of the Yen River, which is unable to overcome the tidal pressure. Consequently, the tides and salinity follow the river, penetrating deep into the mainland.
In the study basin, there are two main reservoirs, Song Muc and Yen My, which were constructed in the late 1980s (Figure 1). Their respective capacities amount to 322.65 and 124.51 million cubic meters. These reservoirs have a crucial role in supplying water during the dry season and regulating floods in the flood season. In recent years, data have been collected concerning the operation of these reservoirs, which is valuable information for research purposes when calibrating hydrological models.
The network of hydrometeorological stations in the basin is somewhat limited (Figure 1). There are only two hydrological stations in the basin, Chuoi and Ngoc Tra, which measure only the water levels and rainfall. Additionally, there are some rainfall stations that provide long-duration and good-quality rain data, ensuring the reliability of research calculations.
2.2. Methodology
A flow regime can be thought of as comprising various flow components, which are specified in detail during the planning process. These components are typically characterized by their magnitude, frequency, duration, and timing (season) of occurrence, as well as their role in supporting critical ecological and physical processes within the river corridor. Commonly recognized flow components include baseflows in the dry season, low season pulses, baseflows in the flood season, flood season pulses, bankfull, and overbank flows. The specification of the desired flow regime in terms of flow components allows a river manager to implement recommendations by directing controlled flows to a river or by preventing inappropriate diversion of flows from a river.
The timing, frequency, and duration of flows are related to the life cycle needs of biota, while the hydraulic conditions may encourage or discourage certain behaviors or even exceed the capacity of some organisms to respond. Aquatic biota exists within a tolerable range of flow velocity and depth. The hydraulic parameters of a river system are subject to significant variation in relation to the discharge of water, and this has a corresponding impact on the availability of certain types of micro-habitat and locations, such as backwaters, tributaries, wetlands, floodplains, and estuaries. The specific hydraulic conditions experienced by a given reach are influenced by the physical characteristics of the river, including its bed material and in-stream large wood or vegetation, as well as the pattern of flows and the supply of sediment. The physical form of the river is shaped by these factors, as well as by the resistance of the channel boundary to change. In rivers where water quality is a limiting factor for biota, it is important to consider the variation in water quality parameters in relation to flow. In estuaries, this is particularly relevant, as the location and characteristics of salinity gradients can be strongly influenced by inflows from the river. To assess the environmental flow in Yen River, this research follows the steps in Figure 2 below. This method is based on the method proposed in [3].
The first step of this research is the process of collecting data and conducting field surveys in the research area. During this process, rainfall data from all of the stations shown in Figure 1 were collected. The water level data were gathered from both hydrological stations, Chuoi and Ngoc Tra, while salinity data were only available at Ngoc Tra station. These stations belong to the Vietnamese hydrometeorological station system. The data at these stations ensures reliability. The reservoir operation data were also gathered for analysis in the subsequent steps. These data included inflow and release discharge measured by reservoir owners. This is useful information when validating hydrological models. The researchers conducted the survey to collect 37 cross-sections along two main rivers, the Yen River and Thi Long River, from the downstream of the Yen My and Song Muc reservoirs to the sea. These data are used as the input for hydraulic models. In addition, 5 sediment data types were sampled to define the grain gradation curve. The study also conducted interviews with local people through the use of survey questionnaires. In total, 28 survey questionnaires were performed in this study. In each questionnaire, information about the current status of river segments, such as information relating to floods, drought, and ecological assets, was provided. Through surveys, this information also helped to determine the desired objectives (water demand, bank erosion protection, navigation, …) for each river segment. Additionally, related documents were collected by the authors, including annual reports of water use planning, annual reports of dike systems in the study area, the operating procedures of the two reservoirs, and the current ecosystem reports of Ben En National Park. These data were also collected from local authorities such as the Thanh Hoa Department of Agriculture and Rural Development, Song Chu Irrigation Exploitation Company, and Ben En National Forest Management Board. Therefore, the information from these documents is official and highly reliable. The collected and surveyed data are summarized in Table 1 below. Examples of the data are presented in the Appendix A in Figure A1, Figure A2, Figure A3, Figure A4 and Figure A5. To simplify the river system, this study divided it into several homogeneous river sections and a representative location of each section. At the end of this step, the stake-holder consultation process was used to set the objective concerning the environmental conditions of each section.
The purpose of comprehensive environmental flow assessments is the identification of environmental objectives relating to river basins. The assessment of environmental flow also defines the flow regime required to meet those objectives (e.g., to sustain important assets in the desired condition). This research was conducted using conceptual models with the aim of determining specific criteria for each river section to meet the proposed requirements. These models can show the relationships between the flow components and the objectives identified in previous steps. Moreover, this study also identified measurable criteria for each of the above-mentioned environmental objectives and flow components. These quantitative criteria can be flow, water level, and salinity for each specific river section.
Within an estuary, the flow of the river is heavily influenced by tidal fluctuations. Due to the scarcity of flow measurement data in the study area, a methodology that integrates hydrological, hydraulic, and water quality models was employed in this study. In this study, the Mike NAM model [15] was applied to convert rainfall to runoff. The structure of the Mike NAM model is presented in Figure 3 below.
The Yen River basin was subdivided into several sub-basins to meet the requirements of the lump parameter model. This approach has been employed in numerous prior studies [17,18,19]. The hydrological model (Mike NAN) outputted the boundaries of the hydraulic model. In this study, a Mike 11 hydraulic model was used for the study area, as illustrated in Figure 4. The foundation of the hydrodynamic module ‘Saint Venant’ equations includes continuity equations and momentum equations. The advection–dispersion equation presents the conservation of mass of a substance in a solution in an advection–dispersion model.
A—flow area (m2);
q—lateral inflow (m2/s);
h—stage above datum (m);
C—Chezy resistance coefficient (m1/2/s);
R—hydraulic or resistance radius (m);
α—momentum distribution coefficient (-);
C—concentration (PSU for salinity);
D—dispersion coefficient (m2/s);
K—linear decay coefficient (h−1);
C2—source/sink concentration (PSU for salinity);
x—space coordinate (m/s);
t—time coordinate (s).
The model has two upstream boundaries, including the released discharge from the Song Muc and Yen My reservoirs (the sub-basins Song Muc and Yen My, respectively). The downstream boundary of the model was based on tide data. At the downstream boundary, the salinity is assumed to be equal to 32 PSU, according to the result of [20]. The model comprised five contribution boundaries. Due to missing cross-section data, the contribution discharges of the Nhon River and Ly River (Figure 1) are derived from the hydrological model’s calculation results from the sub-basins of Nhap Luu 1, Nhap Luu 2, Nhap Luu 3, and Nhap Luu 4, respectively. They are considered to be the point source boundaries in the model and are shown in Figure 4. The contribution discharge from the SM, YM, and Nhap Luu 5 sub-basins contribute to river systems along the river. This leads to the distribution boundaries being used to simulate them (Figure 4). Then, the daily flow of the river system is determined in order to carry out the environmental flow assessment. At each representative location, the flow regime is determined through a number of factors, such as flow duration curve, hydrograph, etc. Based on these results, the frequency and recurrence period of the flow components that meet the established criteria can be determined. However, the setting of environmental flows is a socio-economic as well as scientific process [21]. While natural sciences can provide information on the implications of a changing flow regime, it is the socio-political decisions that determine which ecosystem services should be protected and, therefore, which environmental flows should be provided. This may involve adjusting or trading off environmental objectives against other uses and making decisions on which flow components will be protected or provided to maintain specific ecosystem goods and services. The goal of this step is to perform rigorous scientific analysis in order to identify an appropriate flow regime for both environmental maintenance and social development.
3. Results
3.1. River Segments and Objectives
From the collected information, the study has an overall view of the current state of the basin. This information establishes a common understanding of the intended outcomes for the research area. The river system can be divided into five river reaches (Figure 5). However, each section of the river will have different goals and orders. The first reach is located upstream of the Song Muc reservoir, which includes Ben En National Park. This is an area with a rich and diverse ecosystem, comprising 1417 species of higher plants and 1536 species of animals. The area plays a significant role in preserving ecosystem diversity and abundance in the region. This reach is not affected by saltwater intrusion due to the role of the Song Muc reservoir. The second reach is upstream of the Yen My reservoir, which is not affected by saltwater intrusion, similar to the first segment. This reach has less developed ecosystems compared with the previous reach, with the river’s main purpose being to provide water for domestic and agricultural demands. The downstream rivers of the reservoirs are all affected by saltwater intrusion, but the level of impact is not the same. According to local people, high concentrations of salt water can pervade inland from 16.5 to 23.2 km. This means that in reaches 3 and 4, from the reservoirs to the junction of Yen and Thi Long rivers, saltwater intrusion can occur in the dry season. As a result, the most important objective is to maintain suitable salinity conditions for domestic and agricultural demands. The reach from the junction of the Yen and Thi Long rivers to the sea is dominated by the tide (reach 5). The salinity of this river reach is very high in the dry season. In addition, in this segment, it is important to pay attention to navigate and maintain estuary openings. In conclusion, the objectives in the research area can be grouped into five categories, including hydrology, biology, water quality, connectivity, and geomorphology.
Table 2 shows information about the river segments as well as their representative sites. For reach 1 and reach 2, the representative sites are located at the reservoir inlet. Reach 3 and reach 5 have hydrological stations, so their hydrological station locations are selected to be representative sites for each section. The representative position of reach 4 is the cross-section at Trai Ron. Establishing desired objectives for each section of a river involves defining desired outcomes. The detailed objectives of each river are listed in Table 3.
3.2. Conceptual Model
The flow regime in stream systems contributes to the physical processes and ecosystem functions required to maintain reaches and assure the normal development of aquatic ecosystems. There are many such physical processes and related ecosystem functions. To present a current understanding of these relationships, conceptual models are often an attractive option due to their simplicity. According to [22], there are several forms of conceptual model. They can be text descriptions, process diagrams, or mathematical relationships. In this research, a text description is selected to identify the specific aspects of flow that can support the objectives of each reach. The results are summarized in Table 3.
Dry season baseflows are low-level persistent flows during the dry season. This flow component maintains sufficient width and adequate depth at riffles and pools. It helps to ensure essential habitats for fish and other instream fauna. There is a minimum flow in the channel to maintain instream vegetation and provide water for soils and banks to support riparian vegetation. This flow component purges invasive, introduced species from aquatic and riparian communities and provides drinking water for terrestrial animals. This is especially important for reach 1, where ecological environmental requirements are the top priority. This flow value is usually taken from the smallest monthly flow to the average of the three smallest monthly flows [4]. The value of the dry season baseflow needs to be maintained during the dry season to ensure environmental values.
Dry season pulses have larger flows than dry season baseflows. In a natural system, there are increased flows that result from localized rainfall events. This flow component provides the wetting of instream features, including benches and bars. These hydraulic criteria determine the value of dry season pulses. Based on cross-sectional survey data, this study determined the corresponding flow to flood benches and bars in each reach. Additionally, this flow contributes to the scouring of fine sediment from riffle zones, provides water in pools to break up developing stratification, aids the localized movement of fish between habitats, supports fish spawning, and helps to limit saline intrusions. Dry season pulses should occur at least once every 2 months to prevent water quality issues.
During the flood season, the baseflows of a river are at their lowest, providing only minimal flooding. However, these flows have the advantage of providing a larger habitat for aquatic species. Additionally, they help restore normal water quality by removing pollutants and preventing the migration and colonization of riparian vegetation into the channel. Flood season baseflow occurs with the onset of the flood season and the demand during the flood season.
Flood season pulses are typically larger and longer than dry season pulses and are in line with the natural seasonality of the river. These pulses help move sediment through the river. A high-velocity flow helps to clean out fine sediment from shallow riffle habitats, which determine the size of stream bed substrates (sand, gravel, and cobble). The particle size of the bed material can be sampled in field surveys. The criteria for flood season pulses are a flow value that mobilizes d50 of the bed material. These flows flush away waste products and pollutants, which improves the quality of instream habitats. They also allow better connectivity between habitats. According to the experiences of local people, it is necessary to have two to three heavy rainfall events each year.
Bankfull flows are the maximum discharge that a stream channel can carry without overflowing onto the floodplain. At this point, the water level reaches the top of the channel, which is known as the bankfull stage. According to flood frequency analysis, rivers typically reach their bankfull state once every 1.5–2 years [23]. These flows prevent riparian vegetation from encroaching into the channel and inundating these features within the channel. Bankfull flows input nutrients into the river system, which supports the production of food for aquatic species. They also play an important role in sediment movement within the river and maintain the shape and form of the channel, which is very important for navigation purposes. In addition, they help to clean sediment that has accumulated in important aquatic habitats.
Overbank flows inundate floodplains, which is important for providing lateral connectivity with the channel and floodplain. Overbank flow thresholds are usually determined by the maximum flow in a period of 2 years (small floods) to 100 years (large floods) [24]. These flow events will deposit sediments onto the floodplain, supporting the growth of vegetation (both natural and agricultural). Additionally, these flows trigger a new phase in the life cycle of the ecosystem and introduce nutrients into the river system, which supports the production of food for fish. In addition, overbank flows are the main water supply sources for reservoirs. This is also a requirement to maintain the estuary opening in reach 5.

Table 3.
The table shows the flow components relevant to the objectives.
| Flow Component | Objective | Categories | Reach | Hydraulic Criteria |
|---|---|---|---|---|
| Dry season baseflows | Maintain sufficient width of adequate depth at riffles and pool | Hydrology | 1, 2 | The flow is in range from the smallest monthly flow to the average of 3 smallest months flow |
| Ensure the essential habitat for the fish and other instream fauna | Biology | All | ||
| Maintain instream vegetation | Biology | All | ||
| Support riparian vegetation | Connectivity | 1, 2 | ||
| Purge invasive, introduced species from aquatic and riparian communities | Biology | All | ||
| Provide drinking water for terrestrial animals | Connectivity | All | ||
| Dry season pulses | Provide for the wetting of instream features, including benches and bars | Hydrology | 1, 2 | The flow has the water level at bar level |
| Contribute to scouring of fine sediment | Geomorphology | 3, 4, 5 | ||
| Prevent water quality issues | Water quality | 3, 4, 5 | ||
| Support fish spawning | Biology | All | ||
| Limit saline intrusions | Water quality | 3, 4, 5 | ||
| Flood season baseflows | Provide larger habitats for aquatic species | Biology | All | The flow occurs at onset of flood season |
| Restore normal water quality | Water quality | All | ||
| Preventing the migration and colonization of riparian vegetation into the channel | Connectivity | All | ||
| Flood season pulses | Determine the size of stream bed substrates | Geomorphology | All | The flow has a velocity that can mobilize d50 of the bed material |
| Allowing for better connectivity between habitats | Connectivity | All | ||
| Flush away waste products and pollutants | Water quality | All | ||
| Bankfull flows | Prevent riparian vegetation from encroaching into the channel | Connectivity | All | The flood discharge occurs once every 1.5 2 years |
| Support the production of food for aquatic species | Connectivity | All | ||
| Maintaining the shape and form of the channel | Geomorphology | All | ||
| Overbank flows | provide lateral connectivity | Connectivity | All | The flood discharge has P = 1 50% |
| Deposit sediments onto the floodplain | Geomorphology | 1, 2 | ||
| Trigger a new phase in the life cycle | Biology | All | ||
| Provide water | Hydrology | 1, 2 |
Notes: Q: discharge; Z: water level; D: water depth; V: velocity.
3.3. Hydrological and Hydraulic Model
In order to ensure the accuracy of the calculation results, hydrological and hydraulic models need to be calibrated and validated with the observed data to ensure accuracy. There is no hydrological station measuring discharge in the basin. However, Song Muc reservoir station has measured the inflow to the reservoir in recent years. Therefore, the study uses data from 1 January 2021 to 31 December 2023 to calibrate and validate the hydrological model. The results of the calculated and observed flow are shown in Figure 6. It can be seen that the calculated hydrograph is consistent with the observed data. Table 4 quantifies this concordance through the NASH index [25]. The Nash index can be estimated using Equation (4). According to [26], this result is at a good level. Thus, the set of parameters of the hydrological model well reflects the current status of the Song Muc reservoir basin. The validated parameters are applied to the sub-basins in the model described in Figure 4 to estimate the flow in a long-term period in the whole Yen River basin.
is the calculated discharges at time t (m3/s);
is the observed discharges at time t (m3/s).
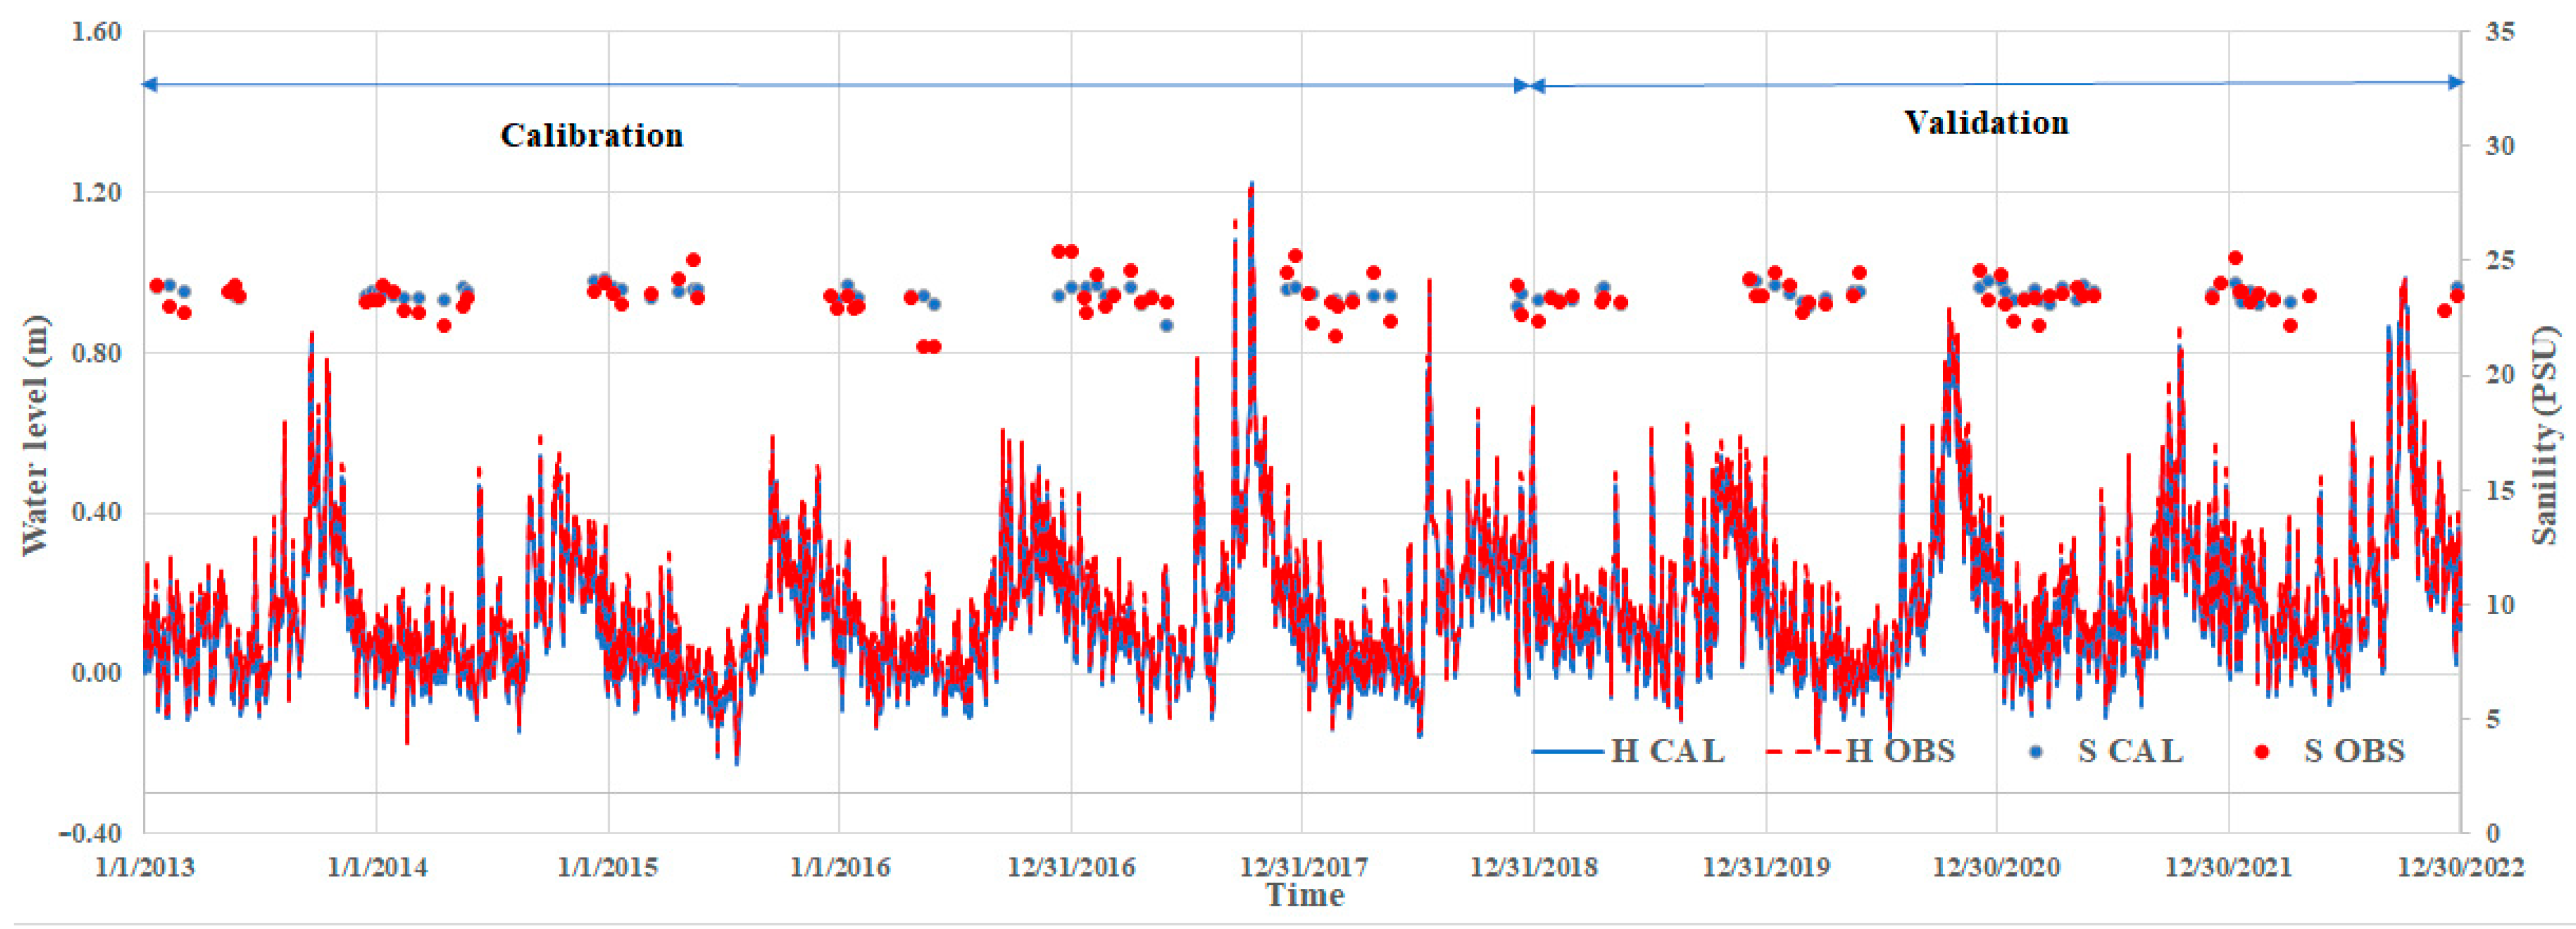
Similar to the hydrological model, the hydraulic model was calibrated and validated using the observed water level data from Ngoc Tra station. The data from 1 January 2013 to 31 December 2017 were used to calibrate the model, while the period data from 1 January 2018 to 31 December 2022 were used to validate the model. The model results are shown in Figure 7 and Table 4. The results also show that the model simulates the hydraulic regime of the Yen River basin well. For the seawater intrusion issue, the result is not as good as the hydraulic regime. However, the simulated salinity value is also consistent with the observed data. This means that this model can be used to determine the daily flow of the river system to serve the next stage of the environmental flow assessment.
The study simulates long-term flow regimes in the study area using validated hydrological and hydraulic models. Figure 8 shows the daily flow at representative locations. Based on these results, the annual module of flow in the Yen River region is about 64 L/s.km2. According to the criteria for seasonal classification [27], the flood season is a continuous period in which the average monthly flow is greater than the average annual flow with a frequency of occurrence greater than 50%. The flow regime in the Yen River basin is divided into two distinct seasons. The flood season is 5 months, from July to November. The total flood volume is 48% to 61% of the total annual volume. In the flood season, the Yen basin is faced with two to three tropical depressions or storms each year, which causes major floods in the basin. The largest flood peak usually appears in July or August. The dry season in the basin lasts from December to June of the following year. During this time, there is little rainfall, leading to the small discharge in the river and the deep inland saltwater intrusion. The average salinity in the dry season at Ngoc Tra station is about 23 PSU.
3.4. Environmental Flow Assessment
The assessment of environmental flow requirements forms the basis of decision making. According to Vietnam’s Law on Water Resources (2012) [28], basin development needs to consider the water use demands of sectors and localities and environmental protection. It means that the processes used to identify environmental objectives for the river basin, such as important environmental assets or processes to be sustained, are not enough. Establishing desired objectives for each section of a river involves defining desired outcomes; however, achieving these goals is a complex undertaking [29]. The river not only has environmental protection purposes but also caters to other water users. Moreover, a river basin is a highly interconnected system in which activities in upstream areas can have an impact on downstream and vice versa. It is necessary to consider the entire system rather than limiting activities to each individual river section. For example, upstream reservoir operation can affect downstream flooding. Additionally, objectives may sometimes conflict with each other. For instance, preventing seawater intrusion during the dry season can conflict with the need to maintain water levels in the reservoir for the water supply. This can lead to trade-offs, and negotiations are often necessary to reconcile these requirements with the needs of other users. This may involve adjusting or trading off environmental objectives against other uses. In this domain of research, the majority of the reaches in the basin, with the exception of reach 1, which remains unaffected by human influence, serve to provide water for agricultural purposes. This calls for satisfying both quantity and quality requirements. With regard to the quantity requirements, the river water level during the water intake period must ensure sufficient depth for pumps to operate. As for the quality requirements, the salinity in the river should not surpass 4PSU since it will impair crop productivity. According to the findings of the surveys conducted on the pumps situated along the river, the minimum depth required to fulfill this condition must be greater than 0.5 m. For river sections 3 and 5, special attention needs to be given to the water transportation needs. For a 20-ton vessel to enter the river mouth, the primary channel width must be wider than 20 m, and the minimum depth needs to range between 1 and 1.2 m. All of these criteria must be taken into account when defining the environmental flow.
An assessment of environmental flows should include the identification of environmental objectives for the river basin and the determination of the flow regime required to achieve those objectives. Based on the hydraulic criteria shown in Table 3, the flow regime was analyzed and selected to not only meet environmental protection requirements but also pay attention to other issues. The study recommends the dry season baseflow value equal to the average flow of the 3 driest months in a long-term period. This is the highest value intended to ensure maximum environmental protection requirements while still being consistent with the promulgated legal documents [4]. This value also helps to ensure environmental protection and reduce pressure on reservoirs when having to release water in the dry season. The flood season baseflow value is determined as an average of monthly flows in July, the onset of the flood season. During this period, due to the abundant amount of water, water usage requirements can be fully adapted. The concentrated flow serves environmental purposes. Selecting the average value for the long term in the basin can ensure the stability of the ecosystem. Based on the hydrological statistics calculated from a modeled flow time series, this study defines the magnitude, frequencies, and durations of events (pulses, bankfulls, and overbanks). The magnitude of pulse events is selected by the 20% exceedance daily flow rate, which was identified by examining the duration of the flow curves for the two sites in the flood and dry seasons. After selecting this value, it is checked to ensure ecological requirements, such as the wetting bar in the dry season and mobilizing coarse material in the flood season. The frequencies corresponding to bankfull and overbank flows are 2% and 1.5% exceedance of the maximum flow rate, respectively. Detailed results are given in Table 5.
4. Discussion
The main outcome of the present study is the insight into the holistic approach to environmental flow assessment. In this research, a flow regime with seven components is quantitatively determined for five river segments of the Yen River basin. When comparing our results with those of older studies, it must be pointed out some improvements have been made in both the dry and flood seasons. Traditional methods, such as Montana the Method [7] or the Wetted Perimeter Method [10], only define critical values to establish a minimum condition for the preservation of the ecosystem. This seems inappropriate since these methods only consider baseflows. Events such as floods now also play an important role in ecosystems. Flood management does not pose a problem for the study area. However, it is a particularly serious problem that has occurred in many areas. Typical examples in Vietnam are the Red River or Mekong River basins, where the upstream reservoirs can store the majority of the flood volume. To maintain a healthy ecosystem, it is also necessary to specify the flood events that are necessary in terms of magnitude, frequency, and duration. In the dry season, our results go beyond previous reports by Gippel et al. (2009) [3]. In this study, we not only combine information on ecological and other assets associated with the river system but also integrate water use needs and legal documents related to the river. Environmental flow components are determined holistically. In addition to ensuring environmental protection, the values given also take into account other water requirements in the catchment area and are consistent with existing legal documents. This ensures a balance of values between environmental protection and the development needs of the catchment area. The regime for environmental flows is now specifically defined using this approach. It facilitates the management of water resources in the basin.
Although some quality aspects are covered, this study focuses primarily on the amount of water that needs to be managed in a catchment to support healthy rivers. This is also a limitation of this study. To resolve this issue, additional observations related to water quality issues need to be conducted to provide input data for modeling. Additionally, this research has other limitations. There are no suitable ecological data from the Yen River to validate the flow regime found. This leads to a weak alignment of the environmental goals with the hydraulic criteria. The proposed hydraulic criteria are subjective and sometimes do not meet all environmental objectives. However, it is still a complex problem that cannot be solved under current research conditions. Ignoring the disadvantages mentioned, there are still many advantages of the approach that need to be mentioned. This research approach is very suitable for limited data sets and for low-budget projects. Field surveying to find out the unique characteristics of each range is essential. However, this content is completely feasible in any basin. If this is not possible, cross-sectional surveys can be replaced by cross-sections processed from digital elevation models. There are now many free DEMs available. These methods are not recommended by the authors because the accuracy is not high. The rainfall input of hydrological models can be easily collected from the rainfall station system. In cases where the collection is impossible, satellite rain sources can be alternative data sources.
Based on the analysis presented, it is evident that the holistic approach employed in environmental flow assessment is viable despite certain constraints. The methods employed seek to strike a balance between safeguarding the environment and fulfilling development demands. This approach can be applied to environmental flow assessments for all other catchments. By integrating mathematical models that simulate the flow regime in the catchment area and the process of field survey and data collection to evaluate river status, the methods are effective. Mathematical models are highly versatile tools that offer detailed information about the hydraulic condition of river basins. Furthermore, the additional data gathered from the investigation process, as requested, are diverse and dependent on the characteristics of the basins. At present, there is no specific standard that governs these additional data. Therefore, future research should focus on enhancing the framework to address these limitations.
5. Conclusions
In this study, a holistic environmental flow assessment is applied to the Yen River, Thanh Hoa, Vietnam. This approach achieves an appropriate balance between allowing for robust analysis whilst reducing complexity and cost as much as possible. The information investigated and collected is not too complicated and detailed. The mathematical model provides fast, detailed results with feasible input data that can be collected in most regions in Vietnam. This approach can be applied even in regions with limited data availability. The assessment result is a whole flow regime, not a single minimum flow value applied throughout the year. This regime includes the magnitude, frequency, and duration of six flow components (dry season baseflow, dry season pulse, flood season baseflow, flood season pulse, bankfull, and overbank). This study was conducted to determine the environmental flow of five reaches in the research basin. This environmental flow ensures that specific, distinctive environmental objectives of each reach are met. In addition, it is consistent with the existing legal and policy requirements in Vietnam and considers water use demands. This issue provides a greater level of confidence in the protection of ecological assets and supporting basin development.
Author Contributions
Conceptualization, C.K.T. and T.P.T.; methodology, C.K.T.; validation, S.T.H. and N.T.H.; formal analysis, N.T.H.; investigation, S.T.H., D.Q.B. and T.P.T.; resources, N.T.H. and L.M.N.; data curation, S.T.H.; writing—original draft preparation, L.H.N.; writing—review and editing, C.K.T.; visualization, L.H.N.; funding acquisition, T.P.T. All authors have read and agreed to the published version of the manuscript.
Funding
This research was supported by the authorized project for Vietnam Academy of Science and Technology, namely “Investigate and evaluate the ecogeomorphologycal conditions of Ben En National Park, propose sustainable solutions for national parks in Vietnam”, grant number UQĐTCB.04/23-24.
Data Availability Statement
The data presented in this study belongs to the project “Investigate and evaluate the ecogeomorphologycal conditions of Ben En National Park, propose sustainable solutions for national parks in Vietnam”. The data are not publicly available due to commercial restrictions.
Conflicts of Interest
The authors declare no conflicts of interest.
Appendix A
Figure A1.
Water level data at Ngoc Tra station in 2022.

Figure A2.
The figure shows an example of Song Muc reservoir operation data.

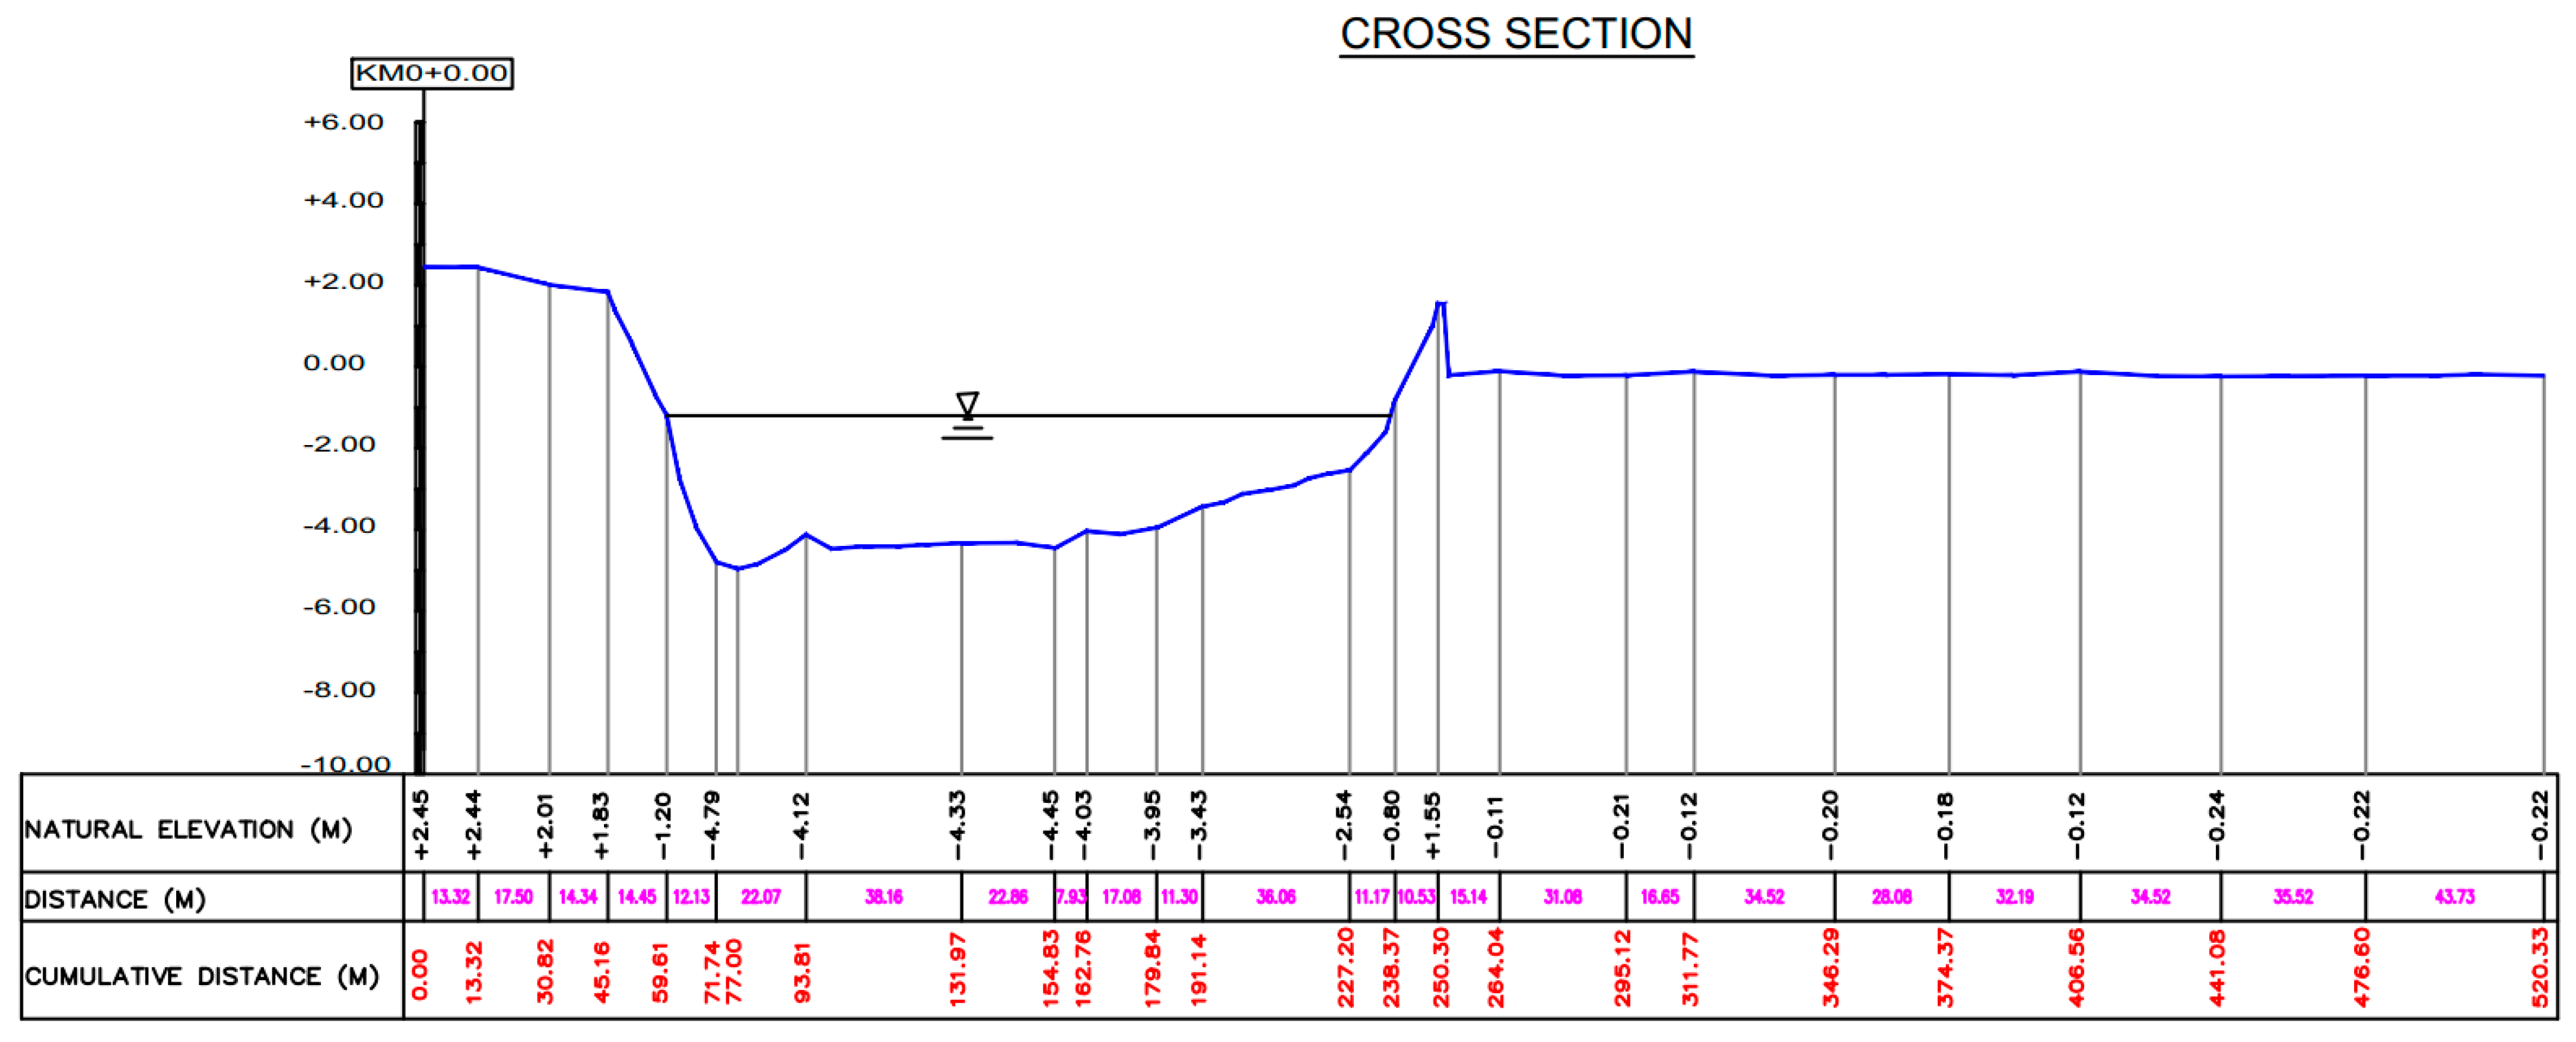
Figure A3.
The figure shows cross-section data at Ngoc Tra station.

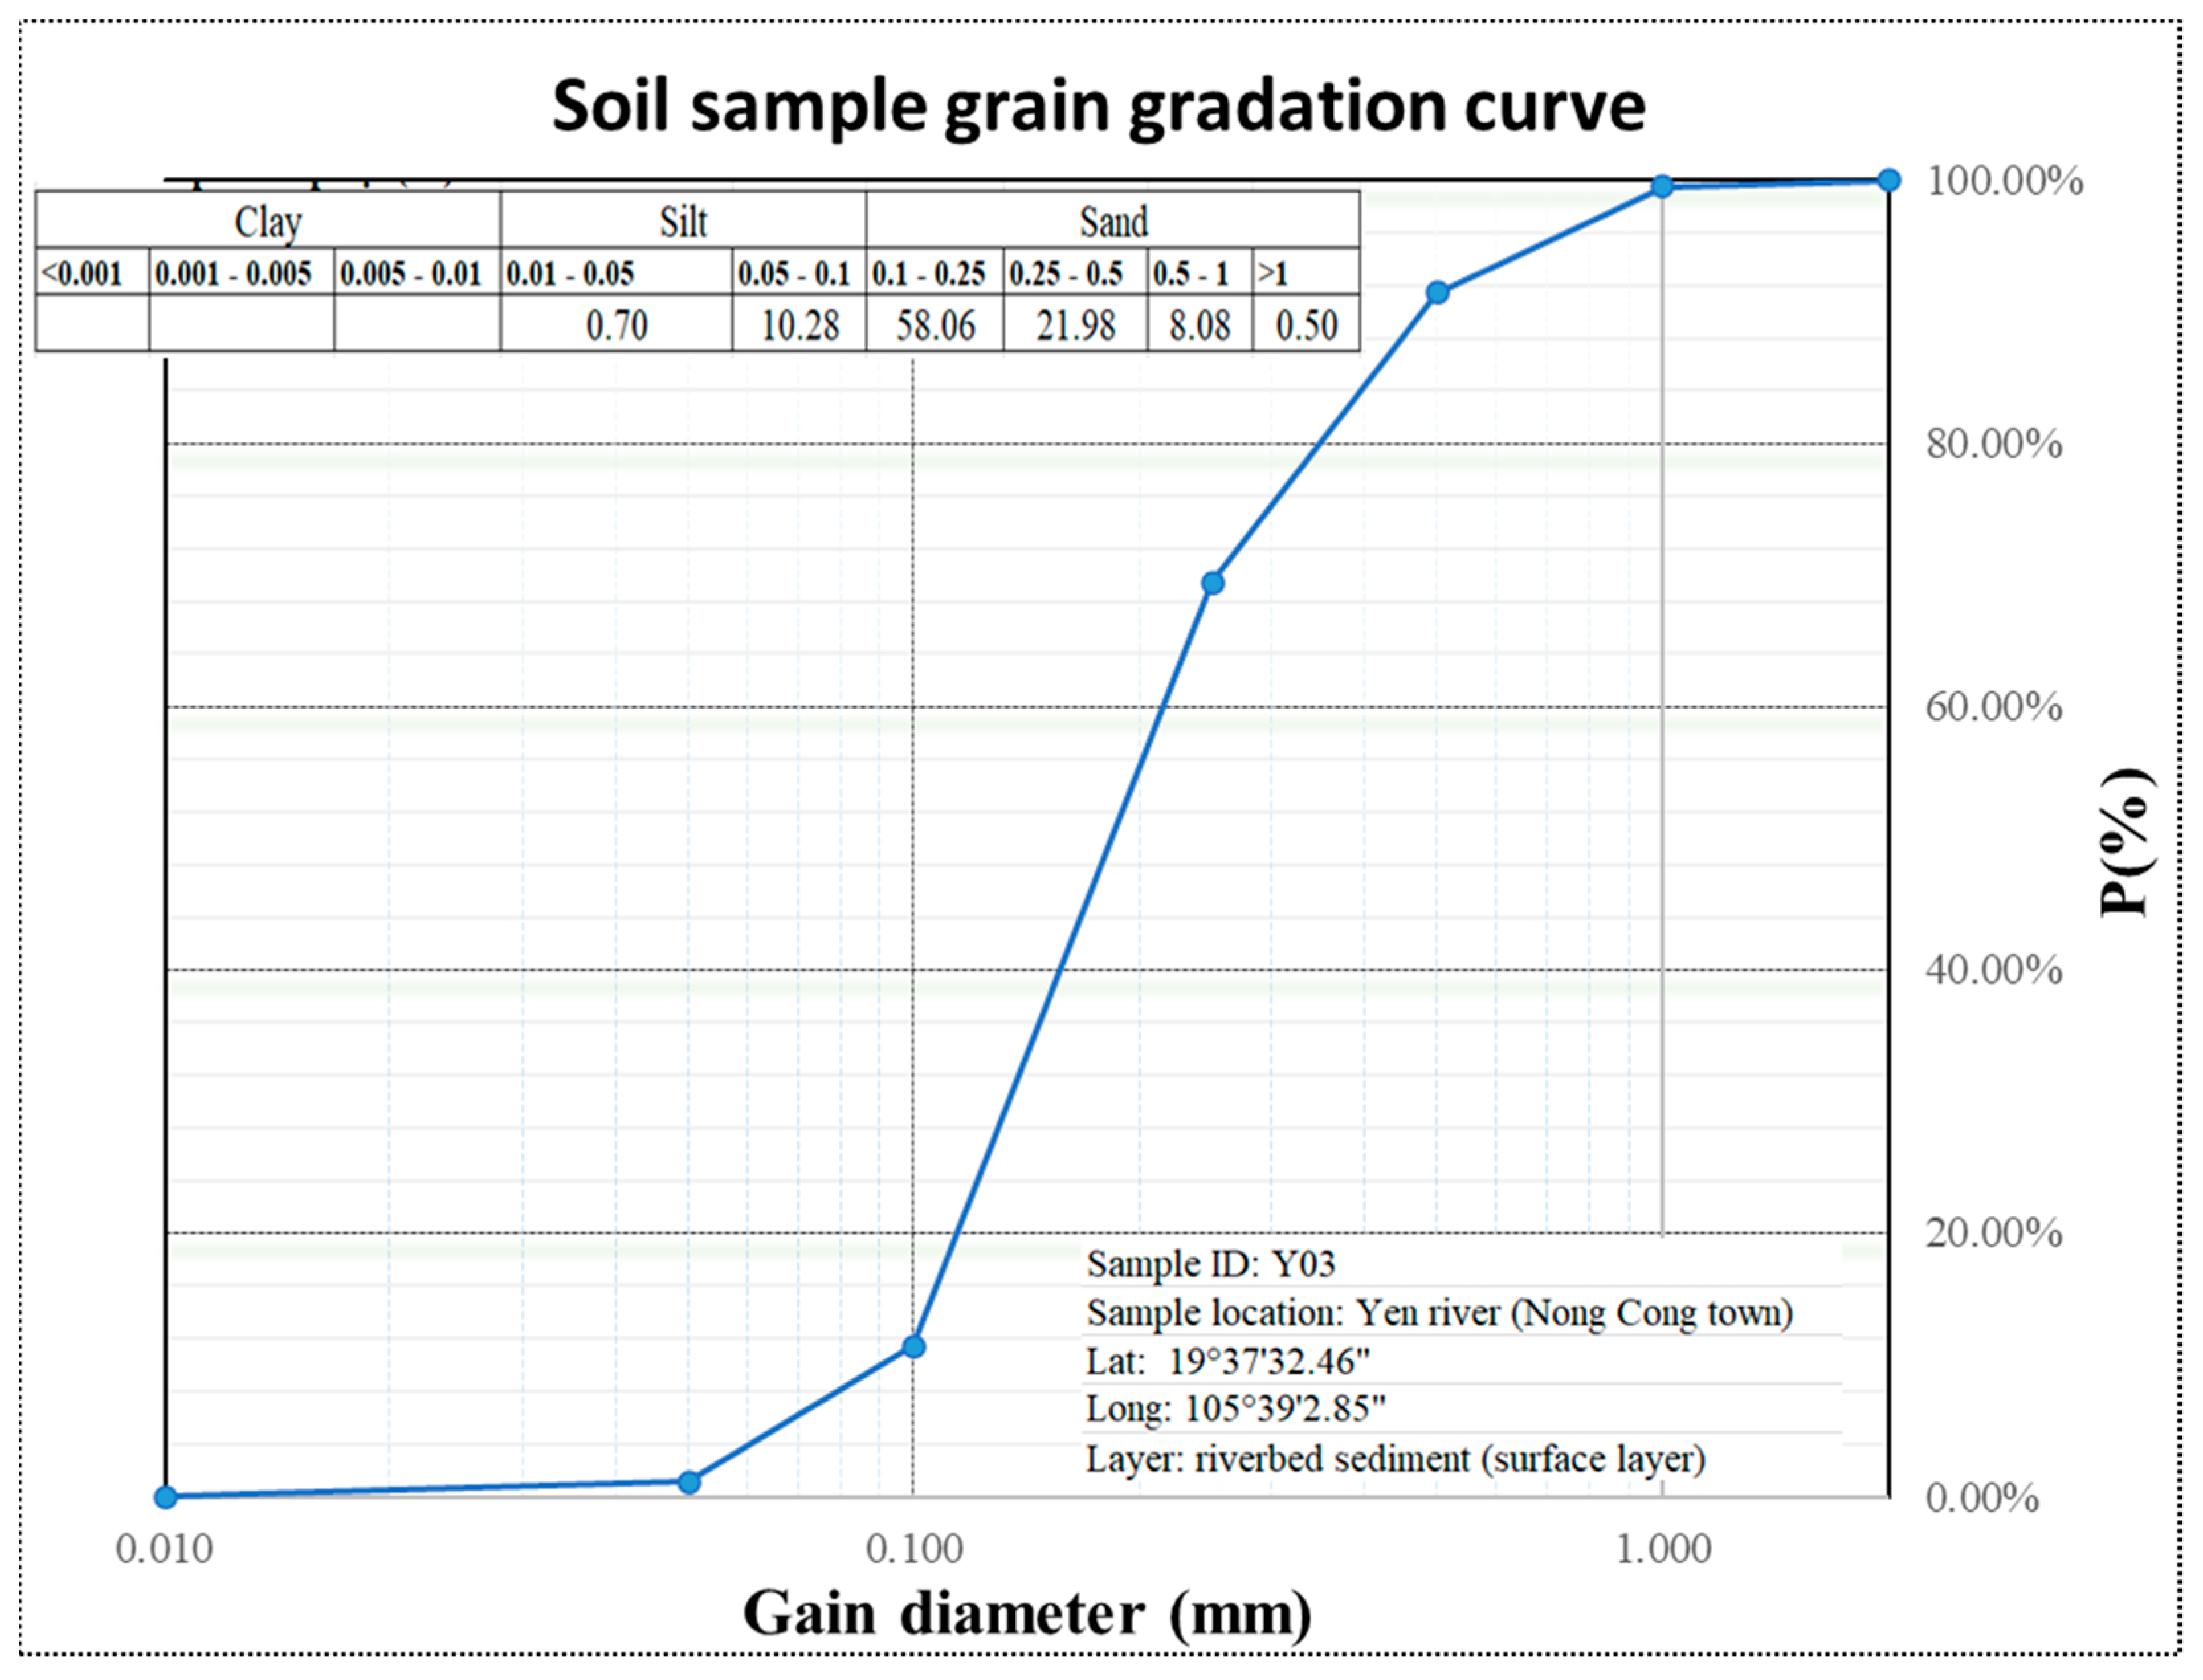
Figure A4.
The figure shows the soil sample grain gradation curve.

Figure A5.
The figure shows an example questionnaire.


References
- The Brisbane Declaration. In Proceedings of the 10th International Riversymposium and International Environmental Flows Conference, Brisbane, Australia, 3–6 September 2007; pp. 1–5. Available online: http://www.conservationgateway.org/Documents/Brisbane-Declaration-English.pdf (accessed on 23 November 2023).
- Chan, K.M.A.; Satterfield, T.; Goldstein, J. Rethinking ecosystem services to better address and navigate cultural values. Ecol. Econ. 2012, 74, 8–18. [Google Scholar] [CrossRef]
- Gippel, C.J.; Bond, N.R.; James, C.; Wang, X. An Asset-based, Holistic, Environmental Flows Assessment Approach. Int. J. Water Resour. Dev. 2009, 25, 301–330. [Google Scholar] [CrossRef]
- Vietnamese Ministry of Natural Resources and Environment. Circular no 64/2017/TT-BTNMT Regulations on Determining Minimum Flows in Rivers, Streams and Downstream of Reservoirs and Dams. Ha Noi, Dec. 2017. Available online: https://thuvienphapluat.vn/van-ban/Tai-nguyen-Moi-truong/Thong-tu-64-2017-TT-BTNMT-quy-dinh-xac-dinh-dong-chay-toi-thieu-tren-song-suoi-ha-luu-cac-ho-chua-372413.aspx (accessed on 21 November 2023). (In Vietnamese).
- Poff, N.L.R.; Tharme, R.E.; Arthington, A.H. Evolution of Environmental Flows Assessment Science, Principles, and Methodologies. In Water for the Environment: From Policy and Science to Implementation and Managemen; Elsevier Inc.: Amsterdam, The Netherlands, 2017; pp. 203–236. [Google Scholar] [CrossRef]
- Wu, X.; Lenon, G.P.; Dong, Y. The calculation of riverine ecological instream flows and runoff profit-loss analysis in a coal mining area of northern China. River Res. Appl. 2020, 36, 760–768. [Google Scholar] [CrossRef]
- Tennant, D.L. Instream Flow Regimens for Fish, Wildlife, Recreation and Related Environmental Resources. Fisheries 1976, 1, 6–10. [Google Scholar] [CrossRef]
- Richter, B.D.; Baumgartner, J.V.; Powell, J.; Braun, D.P. A Method for Assessing Hydrologic Alteration within Ecosystems. Conserv. Biol. 1996, 10, 1163–1174. [Google Scholar] [CrossRef]
- The Nature Conservancy. Indicators of Hydrologic Alteration: Version. 7.1 User’s Manual; The Nature Conservancy: Arlington County, VA, USA, 2009. [Google Scholar]
- Leathe, S.A.; Nelson, F.A. A Literature Evaluation of Montana’s Wetted Perimeter Inflection Point Method for Deriving Instream Flow Recommendations; Department of Fish, Wildlife, and Parks: Helena, MT, USA, 1986. [Google Scholar]
- Stalnaker, C.; Lamb, B.L.; Henriksen, J.; Bovee, K.; Bartholow, J. The Instream Flow Incremental Methodology: A Primer for IFIM; National Biological Service: Washington, DC, USA, 1995. [Google Scholar]
- Kinga, J.; Louwb, D. Instream flow assessments for regulated rivers in South Africa using the Building Block Methodology. Aquat. Ecosyst. Health Manag. 1998, 1, 109–124. [Google Scholar] [CrossRef]
- Williams, J.; Jenkins, G.P.; Hindell, J.S.; Swearer, S.E. Linking environmental flows with the distribution of black bream Acanthopagrus butcheri eggs, larvae and prey in a drought affected estuary. Mar. Ecol. Prog. Ser. 2013, 483, 273–287. [Google Scholar] [CrossRef]
- Vietnamese Ministry of Natural Resources and Environment. Decision No. 341/QD-BTNMT on Promulgating the List of Rivers within Provinces. Ha Noi, Mar. 2012. Available online: https://thuvienphapluat.vn/van-ban/Linh-vuc-khac/Quyet-dinh-341-QD-BTNMT-Danh-muc-luu-vuc-song-noi-tinh-137249.aspx (accessed on 21 November 2023). (In Vietnamese).
- DHI. Mike 11 User Manual; 2020; Available online: https://www.mikepoweredbydhi.com/products/mike-11 (accessed on 21 November 2023).
- Willmott, C.J. On the Validation of Models. Phys. Geogr. 1981, 2, 184–194. [Google Scholar] [CrossRef]
- Tran, C.K.; Do, D.A. Application of Integrated Hydro-Hydraulic Model to Assess the Impact of Infrastructure on Flood Drainage Issue −Case Study for The Downstream of Kone-Ha Thanh River Basin. J. Water Environ. Technol. 2022, 20, 45–58. [Google Scholar] [CrossRef]
- Tran, C.K.; Nguyen, T.T.; Do, D.A.; Nguyen, L.H. Developing the Regression Equations to Determine the Bankfull Discharge from the Basin Characteristics. Arch. Hydroeng. Environ. Mech. 2021, 68, 103–117. [Google Scholar] [CrossRef]
- Tran, C.K.; Nguyen, T.T.; Nguyen, T.T. Primarily Results of a Real-Time Flash Flood Warning System in Vietnam. Civ. Eng. J. 2021, 7, 747–762. [Google Scholar] [CrossRef]
- Niu, M.; Kang, J.; Chen, Z. The Climatic Characteristics of Surface Salinity in the South China Sea and the Adjacent Northwest Pacific Ocean. IOP Conf. Ser. Earth Environ. Sci. 2018, 171, 012028. [Google Scholar] [CrossRef]
- Tickner, D.; Kaushal, N.; Speed, R.; Tharme, R. Editorial: Implementing Environmental Flows: Lessons for Policy and Practice. Front. Environ. Sci. 2020, 8, 106. [Google Scholar] [CrossRef]
- Argent, R.M.; Sojda, R.S.; Guipponi, C.; McIntosh, B.; Voinov, A.A.; Maier, H.R. Best practices for conceptual modelling in environmental planning and management. Environ. Model. Softw. 2016, 80, 113–121. [Google Scholar] [CrossRef]
- Leopold, L.B. A View of the River; Harvard University Press: Cambridge, MA, USA, 1994. [Google Scholar]
- Bertola, M.; Viglione, A.; Vorogushyn, S.; Lun, D.; Merz, B.; Blöschl, G. Do small and large floods have the same drivers of change? A regional attribution analysis in Europe. Hydrol. Earth Syst. Sci. 2021, 25, 1347–1364. [Google Scholar] [CrossRef]
- Nash, J.E.; Sutcliffe, J.V. Ireland’s water budget—Model validation and a greenhouse experiment. J. Hydrol. 1970, 10, 282–290. [Google Scholar] [CrossRef]
- Mccuen, R.H.; Knight, Z.; Cutter, A.G. Evaluation of the Nash-Sutcliffe Efficiency Index. J. Hydrol. Eng. 2006, 11, 597–602. [Google Scholar] [CrossRef]
- Thuyloi University. Vietnamese Standard TCVN 13615: 2022 Calculation of Design Hydrological Elements. Ha Noi, 2022. Available online: https://kttnn.tlu.edu.vn/Portals/0/BM_Thuyvan/TCVNTV_2022.pdf (accessed on 27 February 2024).
- Vietnam National Assembly. Law on Water Resources 17/2012/QH13. Ha Noi, 2012. Available online: https://thuvienphapluat.vn/van-ban/Tai-nguyen-Moi-truong/Luat-tai-nguyen-nuoc-2012-142767.aspx (accessed on 21 November 2023). (In Vietnamese).
- Gawne, B.; Capon, S.J.; Hale, J.; Brooks, S.S.; Campbell, C.; Stewardson, M.J.; Grace, M.R.; Stoffels, R.J.; Guarino, F.; Everingham, P. Different conceptualizations of river basins to inform management of environmental flows. Front. Environ. Sci. 2018, 6, 111. [Google Scholar] [CrossRef]
Figure 1.
The figure shows the research area.

Figure 2.
The figure shows the environmental flow assessment strategy.

Figure 3.
The figure shows the structure of the NAM model (source [16]).
Figure 3.
The figure shows the structure of the NAM model (source [16]).

Figure 4.
The figure shows the Yen River hydraulic model.

Figure 5.
The figure shows river segments and representative locations.

Figure 6.
The figure shows the calculated and observed results of the hydrological model.

Figure 7.
The figure shows the calculated and observed results for the hydraulic model.

Figure 8.
The figure shows a hydrograph of average daily flows at representative sites.

Table 1.
The table shows a summary of collected and surveyed data.
| ID | Data | Source | Example |
|---|---|---|---|
| 1 | Hydrometeorological and salinity data | Hydrometeorological stations | Figure A1 |
| 2 | Operation data | Reservoir owners | Figure A2 |
| 3 | River cross-section | Field survey to collect | Figure A3 |
| 4 | Bed material | Field survey to sample bed material | Figure A4 |
| 5 | Ecological information | Collect from both documents and questionnaires | Figure A5 |
| 6 | Water use information | Collect from both documents and questionnaires |
Table 2.
The river segments in the Yen River system.
| ID | Name | River | Description | Representative Site |
|---|---|---|---|---|
| 1 | Reach 1 | Yen | Upstream to Song Muc reservoir | Song Muc reservoir |
| 2 | Reach 2 | Thi Long | Upstream to Yen My reservoir | Yen My reservoir |
| 3 | Reach 3 | Yen | Song Muc reservoir to junction | Chuoi station |
| 4 | Reach 4 | Thi Long | Yen My reservoir to junction | |
| 5 | Reach 5 | Yen | Junction to the sea | Ngoc Tra station |
Table 4.
The table shows the Nash index of the hydrological and hydraulic models.
| ID | Mode | Variable | Location | Nash Index | |
|---|---|---|---|---|---|
| Calibration | Validation | ||||
| 1 | Hydrology | Discharge | Song Muc reservoir | 0.72 | 0.71 |
| 2 | Hydraulic | Water level | Ngoc Tra station | 0.98 | 0.98 |
| 3 | Hydraulic | Salinity | Ngoc Tra station | --- | --- |
Table 5.
The table shows the flow component summary of the Yen River system.
| Flow Component | Dry Season Baseflow | Dry Season Pulse | Flood Season Baseflow | Flood Season Pulse | Bankfull | Overbank Flow | |
|---|---|---|---|---|---|---|---|
| Flow rate (m3/s) | Reach 1 | 4.03 | 8.92 | 14.5 | 21.7 | 133 | 158 |
| Reach 2 | 3.19 | 6.83 | 10.6 | 17.3 | 95 | 113 | |
| Reach 3 | 4.16 | 17.6 | 26.2 | 39.5 | 187 | 213 | |
| Reach 4 | 5.45 | 11.7 | 18.1 | 31.3 | 113 | 129 | |
| Reach 5 | 15.3 | 54.5 | 117 | 192 | 1057 | 1205 | |
| Frequency (per year) | Continuous | 4 | Continuous | 2 | 0.67 | 0.5 | |
| Duration (days) | Dry season | 1 | Flood season | 2 | 3 | 3 | |
Disclaimer/Publisher’s Note: The statements, opinions and data contained in all publications are solely those of the individual author(s) and contributor(s) and not of MDPI and/or the editor(s). MDPI and/or the editor(s) disclaim responsibility for any injury to people or property resulting from any ideas, methods, instructions or products referred to in the content. |
© 2024 by the authors. Licensee MDPI, Basel, Switzerland. This article is an open access article distributed under the terms and conditions of the Creative Commons Attribution (CC BY) license (https://creativecommons.org/licenses/by/4.0/).
Share and Cite
MDPI and ACS Style
Tong, T.P.; Hoang, S.T.; Bui, D.Q.; Ha, N.T.; Nguyen, L.H.; Nguyen, L.M.; Tran, C.K. Applying a Holistic Approach to Environmental Flow Assessment in the Yen River Basin. Water 2024, 16, 1174. https://doi.org/10.3390/w16081174
AMA Style
Tong TP, Hoang ST, Bui DQ, Ha NT, Nguyen LH, Nguyen LM, Tran CK. Applying a Holistic Approach to Environmental Flow Assessment in the Yen River Basin. Water. 2024; 16(8):1174. https://doi.org/10.3390/w16081174
Chicago/Turabian StyleTong, Tuan Phuc, Son Thanh Hoang, Dung Quang Bui, Ngoc Trong Ha, Linh Ha Nguyen, Lan Minh Nguyen, and Chau Kim Tran. 2024. "Applying a Holistic Approach to Environmental Flow Assessment in the Yen River Basin" Water 16, no. 8: 1174. https://doi.org/10.3390/w16081174
Note that from the first issue of 2016, this journal uses article numbers instead of page numbers. See further details here.