Surfaces of coastal biogenic structures: exploiting advanced digital design and fabrication strategies for the manufacturing of oyster reef and mussel bed surrogates
 Jan Hitzegrad1*
  Leon Brohmann2
  Friedrich Herding3
  Kai Pfennings4
  Sven Jonischkies2 Elisa Scharnbeck1 Jeldrik Mainka2
  Inka Mai3,5
  Christian Windt1 Harald Kloft2
  Achim Wehrmann4 Dirk Lowke3,6
  Nils Goseberg1,7
- 1Leichtweiß-Institute for Hydraulic Engineering and Water Resources, Technische Universität Braunschweig, Braunschweig, Germany
- 2Institute of Structural Design, Technische Universität Braunschweig, Braunschweig, Germany
- 3Institute of Building Materials, Concrete Construction and Fire Safety, Technische Universität Braunschweig, Braunschweig, Germany
- 4Marine Research Department, Senckenberg am Meer, Wilhelmshaven, Germany
- 5Institute of Civil Engineering, Chair of Robotic Fabrication of the Built Environment, Technische Universität Berlin, Berlin, Germany
- 6Department of Materials Engineering, Technical University of Munich, Munich, Germany
- 7Coastal Research Center, Joint Research Facility of Leibniz University Hannover and Technische Universität Braunschweig, Hannover, Germany
Coastal biogenic structures, formed by ecosystem engineering species, often feature rough surfaces characterized by intricate topographies and highly three-dimensional reliefs. Their surfaces are shaped by waves and tidal currents and reciprocally influence the ambient hydrodynamics, reflecting an equilibrium. Despite their significance, the impact of these surfaces on the ambient hydrodynamics remains underexplored due to limited knowledge of accurately replicating their complex topographies in experimental setups. The recent advent of advanced digital manufacturing presents an efficient means to manufacture highly complex, three-dimensional surrogate models for experimental modeling. This work explores the accurate replication of rough coastal biogenic structures for experimental modeling on the examples of an oyster reef and a mussel bed, utilizing a flexible design methodology and, for the first time, particle bed 3D printing with Selective Cement Activation (SCA) as a fabrication and manufacturing method. A workflow is proposed, which includes an iterative surrogate model development based on in-situ topographical features, requirements of the experimental setup, and parameters of the particle bed 3D printer with SCA. The results demonstrate the effectiveness of the methodology in achieving highly accurate surrogate surfaces of complex coastal biogenic structures by validation against a set of topographical features relevant to hydraulic roughness. Particle bed 3D printing with SCA proved to be a suitable method to manufacture complex surrogate surfaces for experimental modeling, offering advantages such as independence of production time from surface complexity. However, challenges persist in achieving exact comparability between the manufactured surrogate surface and the real coastal biogenic structures, particularly for surfaces with very high complexity. Nonetheless, the manufactured generic surrogate surfaces enable detailed investigations into the influence of complex coastal biogenic structures on the ambient hydrodynamics, thereby enhancing the understanding of the processes governing wave energy dissipation attenuation, turbulence production, and vertical mixing – critical for efficient application as a nature-based solution on coastal protection or restoration efforts.
1 Introduction
Intertidal coastal zones are the areas along a coastline that are periodically submerged and exposed due to tidal forces and encompass a wide range of surface types, reflecting different depositional environments and particle sizes, like sandy beaches, mudflats, rippled bed surfaces, and rough gravel beds to highly complex biogenic structures formed by ecosystem engineering species (Jones et al., 1994; Gutiérrez et al., 2003) These biogenic structures (e.g., coral or oyster reefs, mussel beds, coralline algae beds, mangrove forests, or biologically-stabilized surfaces by sea grass, tube worms, or microbial mats) have been the subject of recent research, as they provide several ecosystem services linked to their complex surface structure (Borsje et al., 2011; Bouma et al., 2014; Narayan et al., 2016; Gracia et al., 2018; Morris et al., 2018; Schubert et al., 2020; Dunlop et al., 2023; Solan et al., 2023). For instance, biogenic structures support coastal protection mechanisms by 1) attenuating waves (Lowe et al., 2005; Donker et al., 2013; Harris et al., 2018; Morris et al., 2021), 2) reducing estuarine currents (Reidenbach et al., 2006; Kitsikoudis et al., 2020; Shavit et al., 2022), and 3) stabilizing sediments (van Leeuwen et al., 2010; Chowdhury et al., 2019). Simultaneously, the biogenic structures provide habitats for various species, enhance water quality, and sequester carbon (Ehrnsten et al., 2020).
In the central Wadden Sea, the most extensive seamless system of intertidal sand and mud flats worldwide (UNESCO, 2022) located between the Netherlands, Germany, and Denmark, biogenic structures account for roughly 2 – 6% of the surface area of the tidal basins (Folmer et al., 2014, 2017). Two ecosystem engineering species predominantly form the biogenic structures: 1) the native blue mussel Mytilus edulis and 2) the non-native, invasive Pacific oyster Magallana gigas (Thunberg (1793), formerly referred to as Crassostrea gigas), both bivalve filter-feeders. While M. edulis (shell length of up to 60 mm) forms erodible, low-relief beds, M. gigas (shell length of up to 200 mm) forms rigid, persistent, ultra-rough reef structures (Figure 1). In recent years, the formerly native M. edulis beds have been almost entirely replaced by M. gigas reefs as the predominant biogenic structure (Diederich, 2005; Nehls et al., 2006; Reise et al., 2017). The surfaces of both types of biogenic structures are rough and topographically complex but differ in macroscale (e.g., surface morphology and cluster formation) and microscale (e.g., abundance, shell shape and length, and attachment mechanism) characteristics. This is due to the different growth patterns of the two distinct ecosystem engineering species. The resulting differences between these two biogenic structure types formed the primary motivation of this study, which aimed to accurately replicate these surfaces for experimental modeling.
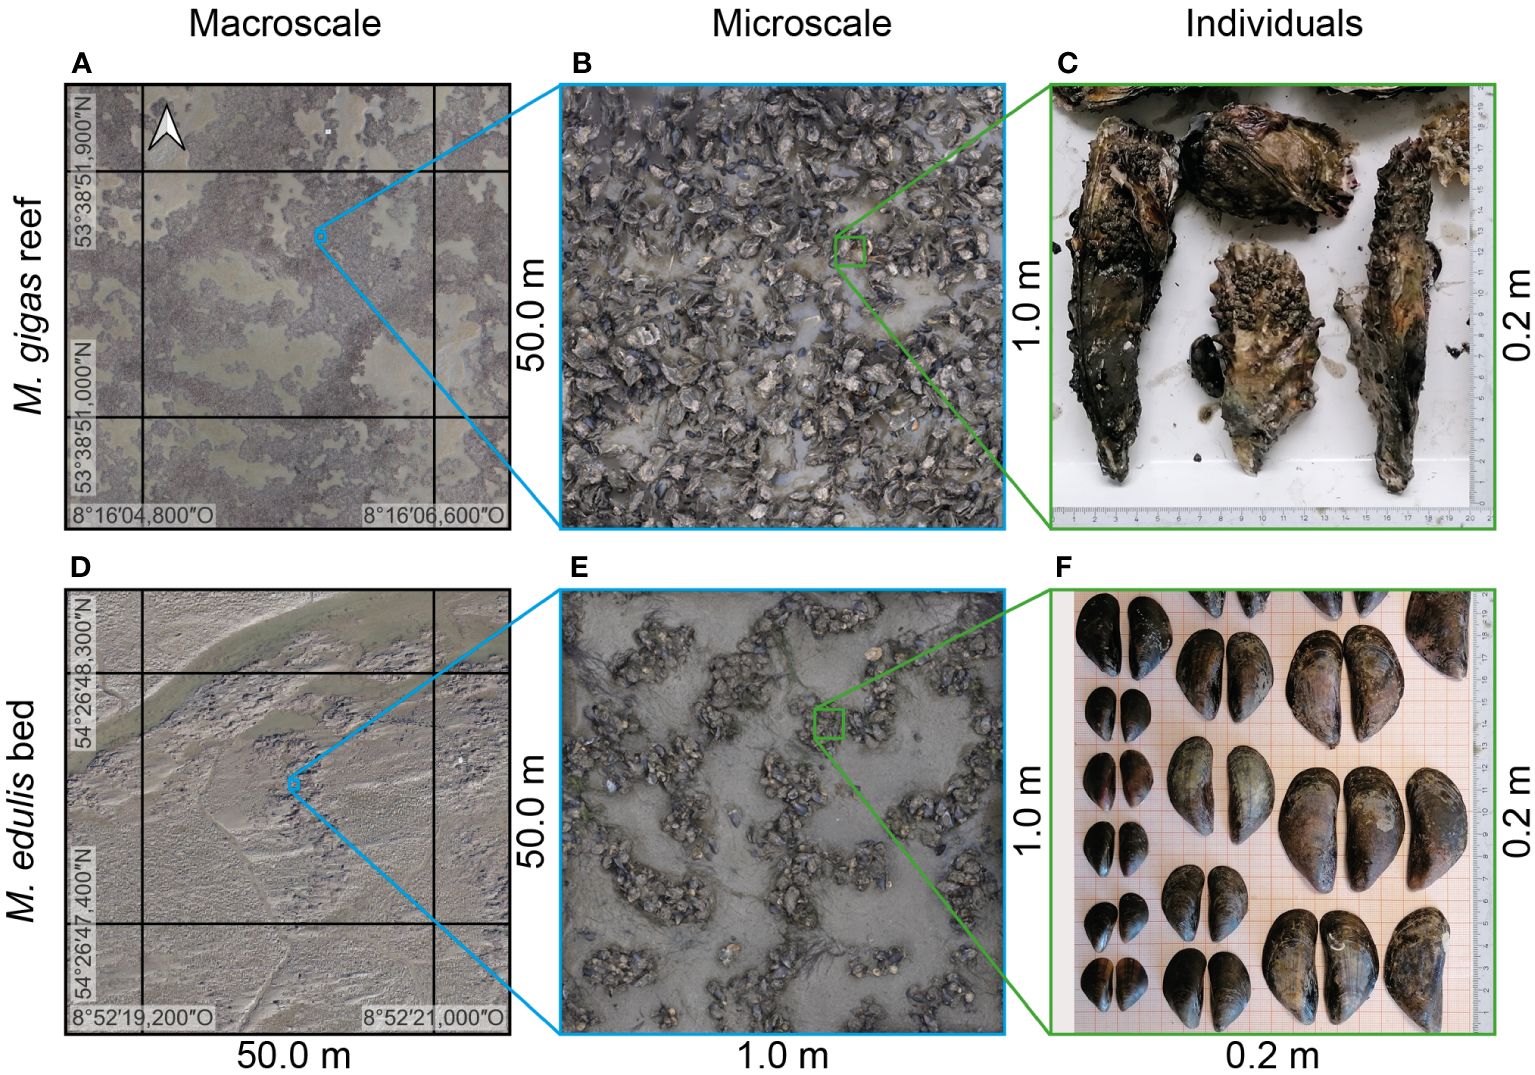
Figure 1 Photographs illustrating the differences between Magallana gigas reefs and Mytilus edulis beds at (A, D) macroscale (orthophoto; courtesy of Leibniz University Hannover), (B, E) microscale (orthophoto), and (C, F) the shell morphology of the individuals, respectively.
Both biogenic structures, mussel beds and oyster reefs, are influenced by the local hydrodynamics and vice versa, reflecting an equilibrium. The filter-feeding mode of both species benefits from the increased turbulence as their rough surfaces induce vertical mixing in the water column, enhancing food availability. M. edulis beds are known to withstand moderate hydrodynamic forces (Hunt and Scheibling, 2001), but individuals can be dislodged, and whole beds can be obliterated by drifting ice or more severe storm events (Widdows et al., 2002, 2009; Donker et al., 2015). Conversely, M. edulis beds dissipate wave and tidal current energy due to their rough surface (Butman et al., 1994; Folkard and Gascoigne, 2009; van Leeuwen et al., 2010; Donker et al., 2013; Baxter et al., 2022). In contrast, M. gigas reefs demonstrate significantly higher resistance to mechanical stresses induced by waves, tidal currents, or ice drift due to their cemented left valves forming a rigid framework (Smaal et al., 2005; Taylor and Bushek, 2008; Bungenstock et al., 2021). Furthermore, M. gigas reefs are expected to cause significantly stronger wave and tidal current energy dissipation due to their significantly higher topographical roughness (Borsje et al., 2011; Hitzegrad et al., 2024). However, unlike the well-studied interactions of ambient hydrodynamics with reefs formed by the American oyster Crassostrea virginica (Gmelin, 1791) (Garvis, 2012; Whitman and Reidenbach, 2012; Reidenbach et al., 2013; Manis et al., 2015; Lunt et al., 2017; Wiberg et al., 2019; Kitsikoudis et al., 2020; Zhu et al., 2020; Morris et al., 2021), studies investigating the interactions with M. gigas reefs remain sparse. Borsje et al. (2011) showed the more substantial wave attenuation of an M. gigas reef compared to an M. edulis bed in a basic experimental setup using real shells. However, the hydrodynamic conditions were chosen to illustrate the distinct behavior of the two biogenic structures and not to depict relevant hydrodynamic conditions. Hitzegrad et al. (2024) investigated the influence of the sharp-edged roughness elements, e.g., the ventral margins of oyster shells, on waves using two-dimensional (2D) surrogate models. They conclude that the sharp edges significantly influence wave energy dissipation and turbulence production but call for more research, including additional reef characteristics in the experimental design. Thus, to the authors’ knowledge, comprehensive investigations of oyster reef and mussel bed impacts on wave and tidal current dissipation are lacking. However, this type of study is fundamentally difficult as there is little knowledge as to how the complex surface structures are best and most accurately replicated in experimental setups.
In experimental modeling, hydraulic systems are replicated in a simplified manner (prototype), often scaled down, and investigated under controllable laboratory conditions (Hughes et al., 2016). This requires the fabrication of replications of the real-world environments, i.e., surrogate models, which accurately represent the investigated parameters, e.g., topographical features or geometries. Typically, surrogate models, when chosen as a research tool, are limited by (1) the dimension and availability of the test facility in combination with (2) the limitations of the manufacturing methods, and (3) economic factors, e.g., feasibility as well as time for implementation and manufacturing (Briggs, 2013). To fulfill these criteria, experimental conditions are typically scaled down and simplified, maintaining a similitude of the relevant forces, velocities, and dimensions while neglecting secondary effects by applying a Froude or Reynolds scaling (Hughes, 1993).
In the past, approximating complex coastal surfaces has been a considerable challenge (Hughes, 1993; Pfrommer et al., 2015). Conventional approaches for manufacturing surface surrogate models are characterized by labor-intensive manual work and multiple production steps. Hence, model fabrication is often time-consuming, expensive, prone to errors, and can result in levels of simplifications that are far from in-situ conditions (Briggs, 2013; Aberle et al., 2021). Often, semi-finished materials have been used to minimize costs and time, significantly reducing the complexity of the surrogate models. Rough coastal surfaces have been approximated by, e.g.:
• Construction profiles and concrete casts as a representation of rippled bed surfaces (Fredsøe et al., 1999; Mathisen and Madsen, 1999; Mirfenderesk and Young, 2003; Raushan et al., 2020),
• ping pong balls, marbles, and tubes as a representation of gravel beds and porous seafloors (Dixen et al., 2008; Lin et al., 2013; Yuan and Madsen, 2014; Arnaud et al., 2017; van Rooijen et al., 2020), and
• cubes, semicircles, or lamella as a representation of biogenic structures, e.g., coral reefs, oyster reefs, and mangrove forests (Lowe, 2005; Strusińska-Correia et al., 2013; Singh et al., 2016; Yao et al., 2020; Shounda et al., 2023; Hitzegrad et al., 2024).
While all studies have contributed to a better understanding of the interactions between rough coastal surfaces and hydrodynamics, the simplifications compared to the respective real surface can lead to undesired deviations referred to as laboratory or model effects, which may compromise the validity of the results (Aberle et al., 2021). Furthermore, due to their complex nature, intricate topographical characteristics, e.g., porosity or tortuosity of porous seafloors, as well as overhangs within rough surface structures, pose significant challenges for the representation. Thus, surrogate models manufactured by conventional methods often cannot accurately replicate the surface characteristics of rough coastal surfaces within an appropriate time and economic framework.
With the advent of advanced digital manufacturing, new methods are now available to streamline and optimize experimental modeling workflows with the benefit of greater cost-effectiveness and more accurate surface surrogate models, yet without being applied to complex coastal surfaces (Aberle et al., 2021). High-resolution, three-dimensional (3D) topographic data in the form of digital elevation models (DEMs) are however a requirement for advanced digital manufacturing and have only recently become widely available due to the development of novel acquisition techniques, e.g., terrestrial laser scanning, sonar survey, and structure-from-motion photogrammetry (SfM) (Faulhaber, 2007; Westoby et al., 2012; Leon et al., 2015; Hodge and Hoey, 2016a; James et al., 2017; Mazzoleni et al., 2020; Hoffmann et al., 2023). When combined with digital fabrication methods, this data enables the generation of 3D, high-resolution surrogate models (Henry et al., 2018). Digital fabrication encompasses diverse techniques and methodologies in which physical 3D objects are shaped after digital design data and fabricated in various materials, e.g., metals, polymers, or concrete. Subtractive manufacturing (SM) and additive manufacturing (AM) are the most prominent methodologies (Gibson et al., 2021).
In SM, material is removed from a solid workpiece by various machining operations, e.g., milling, turning, drilling, or grinding, carried out by a computer numerical control (CNC) system (Pfrommer et al., 2015; Groover, 2020). SM excels in accurately reproducing small-scale topographical features but faces inherent challenges regarding complex 3D shapes, cavities, and overhangs. SM is a well-established method in experimental modeling to reproduce large DEMs at a small scale and moderate resolution. Faulhaber (2007) fabricated a riverbed model at a scale of 1:350 to investigate the bed load transport. Henry et al. (2018) and Aberle et al. (2021) demonstrated the accurate reproduction of unlined rock-blasted tunnel topographies based on terrestrial laser scanning at a scale of 1:15. Stewart et al. (2019) fabricated surfaces with self-affine fractal roughness patterns to investigate the influence of spectral structures on hydraulic resistance. To reduce manufacturing time, a master tile was produced using CNC milling, and replicas were cast in epoxy resin. A comparison of the wavenumber spectra revealed generally high agreement between digital target and manufactured surfaces but difficulties of the CNC milling reproducing steep gradients in the roughness patterns. These studies demonstrate the ability of SM to reproduce terrestrial surfaces with moderate complexity but face challenges in reproducing small-scale roughness, cavities, or overhangs. Furthermore, production time increases with increasing complexity of the model. To manufacture large surrogate models incorporating small-scale irregularities, further research and novel methods are required, particularly when considering economic factors.
AM enables the fabrication of highly intricate 3D shapes and geometries, thus overcoming the limitations of SM in reproducing small-scale roughness, valleys, overhangs, and cavities (Mainka et al., 2016; Aberle et al., 2021; Gibson et al., 2021). In AM, commonly known as 3D printing, objects are mostly fabricated through a computer-controlled layer-by-layer process, wherein the material deposition or selective binding is precisely executed exclusively at designated positions (Kim et al., 2016; Gibson et al., 2021). Moreover, various materials and fabrication methods can be selected, ranging from compact and affordable consumer 3D printers to large-scale professional systems, enabling a wide range of applications (Ngo et al., 2018; Gibson et al., 2021). In recent years, AM has gained popularity across various industries as a viable manufacturing approach, e.g., aerospace and automotive manufacturing (Khajavi et al., 2014; Grady et al., 2015), health care and medical devices (Murphy and Atala, 2014; Kim et al., 2016), architecture and construction (Wu et al., 2016; Lindemann et al., 2017; Lowke et al., 2018; Kloft et al., 2019; Buswell et al., 2020), and eco-engineering of artificial reefs (Salaün et al., 2020; Evans et al., 2021; Reis et al., 2021; Levy et al., 2022; Perricone et al., 2023).
In experimental modeling, several AM methods have been utilized. Fused deposition modeling (FDM) using thermoplastics has been employed as a cost-efficient consumer-grade method. Hodge and Hoey (2016a) and (2016b) fabricated a model of a bedrock-alluvial river, scaled 1:10, based on terrestrial laser scanning. Oertel and Shen (2022) explored the application of FDM to fabricate complex geometries using a scaled weir model. Their findings indicate that surrogate models produced by FDM effectively fulfill experimental requirements, yielding similar hydrodynamic performance as conventionally manufactured surrogate models. Nonetheless, layer-by-layer printing can produce a relatively imperfect surface finish depending on layer thickness (Hartcher-O’Brien et al., 2019; Gibson et al., 2021; Mazen et al., 2022). Dunbar et al. (2023) fabricated a periodic section of a gravel bed (L × W = 315 × 300 mm) with an accuracy of<100 μm from polylactide as a master tile and cast replicas from epoxy resin, similar to Stewart et al. (2019). Material jetting (MJ) using photopolymers has been employed to fabricate highly accurate surrogate models at small scales. Bertin et al. (2014) fabricated a highly accurate section of a gravel-bed topography with known surface elevations at every 0.25 mm to assess the accuracy of DEMs captured with stereo-photogrammetry. Flack et al. (2020) fabricated four generic rough surfaces with varying topographies but similar surface statistics with a lateral resolution of 34 μm to investigate the skin friction in unidirectional flow. The authors illustrated that the multiple topographical parameters, e.g., the root-mean-square roughness height, krms, and skewness, Sk, of the distribution of the surface level elevations, are necessary to predict bed friction effects. Selective Laser Sintering (SLS) has been utilized to craft surrogate models of shellfish aquaculture. Landmann et al. (2019) and Landmann et al. (2021a) fabricated parameterized M. edulis dropper lines by SLS to analyze the impact of hydrodynamic loads. Their results suggest that a design based on parameterized shell parameters shows the best agreement to measured drag and inertia coefficients of real M. edulis dropper lines. Landmann et al. (2021b) used SLS to fabricate a surrogate model of the Shellfish Tower, an offshore aquaculture structure, at a scale of 1:20 to measure hydrodynamic forces on the mooring system while controlling the mass, buoyant forces, and pretension in the mooring. Furthermore, AM methods have been applied to fabricate surrogate models of biofouling on offshore structures (Zeinoddini et al., 2017; Marty et al., 2021; Zou et al., 2023). These studies illustrate that AM offers the potential to significantly enhance the accuracy and complexity of surrogate models compared to SM. Nevertheless, despite these advancements, in the currently applied methods, a balance between the accuracy and spatial dimensions of surrogate models must often be found in the design of experiments, as production time increases significantly with model complexity (Gibson et al., 2021). Further research is needed to optimize this balance for various applications.
Particle bed 3D printing by selective cement activation (SCA) is a novel methodology in construction and architectural design that allows the fabrication of complex geometries without increasing production time (Lowke et al., 2018, 2020; Weger et al., 2021; Herding et al., 2022). It has been developed for applications that typically feature complex geometries but with higher dimensional accuracy and lower surface roughness than other AM methods. The methodology is based on the selective intrusion of water or a water-admixture solution into a particle bed, which consists of a mixture of sand (typically< 1 mm) and cement as a binder (Lowke et al., 2024). The cement is locally activated by applying the liquid, creating a cement paste matrix around the aggregate particles, which subsequently hardens precisely where the liquid is applied. By repeating this in a layer-by-layer process, a 3D object is formed. Since the non-activated particles are mechanically stable and a building chamber supports the surrounding material during production, the fabrication of geometries with overhangs and undercuts can easily be realized. The dimensional accuracy of SCA components, i.e., the deviation of the fabricated to the digital target geometry, depends on several parameters as it increases with, e.g., a decreasing amount of applied liquid or increasing amounts of binder and additives (Lowke et al., 2022; Mai et al., 2022a, Mai et al., 2022b; Herding et al., 2023). As a result, the process offers minimal design restrictions, enabling the fabrication of, e.g., enclosed voids and cavities without increasing manufacturing time (Lowke et al., 2018; Herding et al., 2022; Talke et al., 2023). It is, thus, proposed that particle bed 3D printing with SCA offers a novel approach for fabricating and manufacturing surrogate models for experimental modeling with complex surface structures, mitigating the inherent limitations of AM in terms of time efficiency while maintaining a high degree of accuracy.
This study aims to explore how complex coastal surfaces of biogenic structures, i.e., oyster reefs and mussel beds, can accurately be replicated for experimental modeling using advanced digital design and additive manufacturing strategies. Considering the above-outlined existing knowledge gaps, this work pursues the following objectives:
1. To develop a flexible design methodology for a continuous digital workflow, linking field study, data analysis, parameterization, computer-aided design, and additive manufacturing to fabricate and manufacture the surrogate models.
2. To investigate the constraints of the design methodology by comparing characteristic topographical roughness parameters of the two manufactured surrogate surfaces to those of in-situ oyster reef and mussel bed surfaces.
3. To determine the inherent accuracy and uncertainties of particle bed 3D printing with SCA for complex and ultra-rough surfaces on the examples of an oyster reef and a mussel bed surrogate model.
Thus, for the first time, this work evaluates the application of particle bed 3D printing with SCA in light of complex coastal biogenic structures geared toward scale modeling of coastal flow processes.
2 Materials and methods
2.1 Target coastal biogenic structures
The two most common biogenic structures in the central Wadden Sea have been selected as target complex coastal surfaces of this investigation: 1) Mussel beds formed by the native M. edulis and 2) oyster reefs formed by the non-native and invasive M. gigas (Figure 1). In the following, their specific topographical characteristics are outlined.
M. edulis is formed by two symmetrical valves with a characteristic elliptical, oval outline and a smooth shell surface, partly colonized by barnacles (Gosling, 2015; Hayward and Ryland, 2017) (Figure 1F). Shape and size variations are sensitive to abiotic (e.g., temperature, food supply, salinity, and acidity (Seed and Suchanek, 1992; Bergström and Lindegarth, 2016; Telesca et al., 2018)) and biotic factors (e.g., intraspecific and interspecific competition (Seed, 1968; Buschbaum and Saier, 2001)). Typical adult individuals are between 50 and 150 mm long (Gosling, 2015; Hayward and Ryland, 2017), while in the central Wadden Sea, shell sizes do not usually exceed 60 mm (Buschbaum and Saier, 2001). M. edulis individuals attach themselves with diffuse, fibrous byssus threads to any hard substrate, e.g., rocks, shells, or artificial structures such as wooden or steel poles; byssus connections typically withstand harsh environmental conditions (Brenner and Buck, 2010). The byssus threads allow individuals to selectively release and reattach, providing them moderate positional flexibility or even mobility. When M. edulis individuals die, the byssus threads degenerate, causing the individuals to detach and the shells to fall off or wash away.
On soft sediments, M. edulis form spatially extensive beds ranging from tens of meters to square kilometers (Dankers et al., 2001; van de Koppel et al., 2005). Within mussel beds, spatial patterns occur due to self-organization at the macro- (Figure 1D) and the microscale (Figure 1E). At the macroscale, mussel beds form isolated patches or spatially extensive surfaces with structurally patterned or almost homogeneous mussel coverage (Wehrmann, 2003; van de Koppel et al., 2005; Liu et al., 2014; Sherratt and Mackenzie, 2016; Bungenstock et al., 2021). Banded patterns have been observed, alternating between patches with dense agglomerations of individuals and almost bare sediment surfaces with wavelengths of 5 – 10 m, as a response to wave action and tidal currents to improve feeding efficiency (van de Koppel et al., 2005, 2008; Wang et al., 2009; van Leeuwen et al., 2010; Sherratt and Mackenzie, 2016). At the microscale, the individuals aggregate in reticulate networks of clusters, forming net-shaped patterns (~0.15 – 0.30 m; Figure 1E) with abundances N = >2000 individuals/m2 (in parts covered in mussels). By organizing in dense agglomerations separated by bare sediment, mussel beds increase turbulence production and, thus, food provision for filter-feeding through vertical mixing in the water column (Widdows et al., 2002, 2009). Liu et al. (2013), (2014), and (2016) showed that the pattern formation at the microscale arises from the active movement of the individuals based on the density (or abundance) similar to the phase separation of two mixed fluids.
M. gigas is formed by two unequal, irregular rugged valves (Figure 1C). The shell shapes are highly variable, typically concentrically shaped, with six distinct ribs on the valves and shiny, notched, saw-toothed shell surfaces. Typical shell sizes reach 80 – 200 mm in length and 50 – 100 mm in width (Nehring, 2011; Gosling, 2015; Hayward and Ryland, 2017). Similar to M. edulis, their growth, shell shape, and orientation depend on abiotic (e.g., temperature, tidal amplitude, salinity, air exposure duration, wave action, and flow velocities) and biotic factors (e.g., food availability and inter-/intraspecific competition) (Miossec et al., 2009; Nehring, 2011; Gosling, 2015; Hayward and Ryland, 2017). M. gigas require hard substrates to settle on, e.g., rocks, sea walls, or other shell material. In contrast to the flexible attachment of M. edulis by byssus threads, M. gigas individuals exhibit a permanent adhesion behavior, cementing their left valve to the substrate (Burkett et al., 2010; Tibabuzo Perdomo et al., 2018). When individuals die, their shells persist, serving as a favorable settlement substrate for succeeding generations (Quayle, 1988; Arakawa, 1990; Diederich, 2005). By establishing new generations on the bound shells of deceased individuals, permanent reef structures are formed, which can continue to expand horizontally, vertically, and volumetrically, depending on environmental influences (Folmer et al., 2017; Bungenstock et al., 2021; Hoffmann et al., 2023).
In the central Wadden Sea, M. gigas settled on the M. edulis beds as the only available hard substrate, subsequently transforming them into rigid oyster reefs (Reise, 1998; Wehrmann et al., 2000; Brandt et al., 2008; Folmer et al., 2017; Reise et al., 2017). Consequently, at the macroscale, similar spatial extents and patterns to the formerly predominant M. edulis beds exist in the newly-formed M. gigas reefs (Figure 1A). At the microscale, M. gigas reefs exhibit highly heterogeneous surfaces ranging from isolated clusters over coherent patches to spatially extensive, uniformly populated surfaces (Markert, 2020; Hoffmann et al., 2023) (Figure 1B). Hitzegrad et al. (2022) proposed a structural classification in seven classes based on spatial patterns and statistical surface parameters (Cluster I, Cluster II, Patch I, Patch II, Garland, Transitional Zone, and Central Reef). The oysters typically arrange themselves in homogeneous surfaces with high abundances of up to 750 inds./m2, where individuals are densely packed and vertically oriented, except for the cluster classes.
2.2 Workflow
In this study, generic surface models are developed as surrogate models instead of direct replications of in-situ surfaces. The generic surface models are optimized to reflect topographical parameters, describing the surfaces at the microscale as well as the individual elements, i.e., shells, proven relevant for hydraulic roughness (Chung et al., 2021), while excluding site-specific, biasing local characteristics, similar to Marty et al. (2021); Landmann et al. (2021a), or Stocking et al. (2018). It is expected that fundamental hydraulic roughness properties of complex coastal surfaces are more accessible to energy dissipation analysis, thus yielding more universally applicable results. Hereby, particle bed 3D printing with SCA enables the rapid production of prototypes, facilitating an optimization of the parameterization. The workflow employed for the development of the surrogate models and the steps involved in achieving the desired parameterization for the fabrication are illustrated in Figure 2.
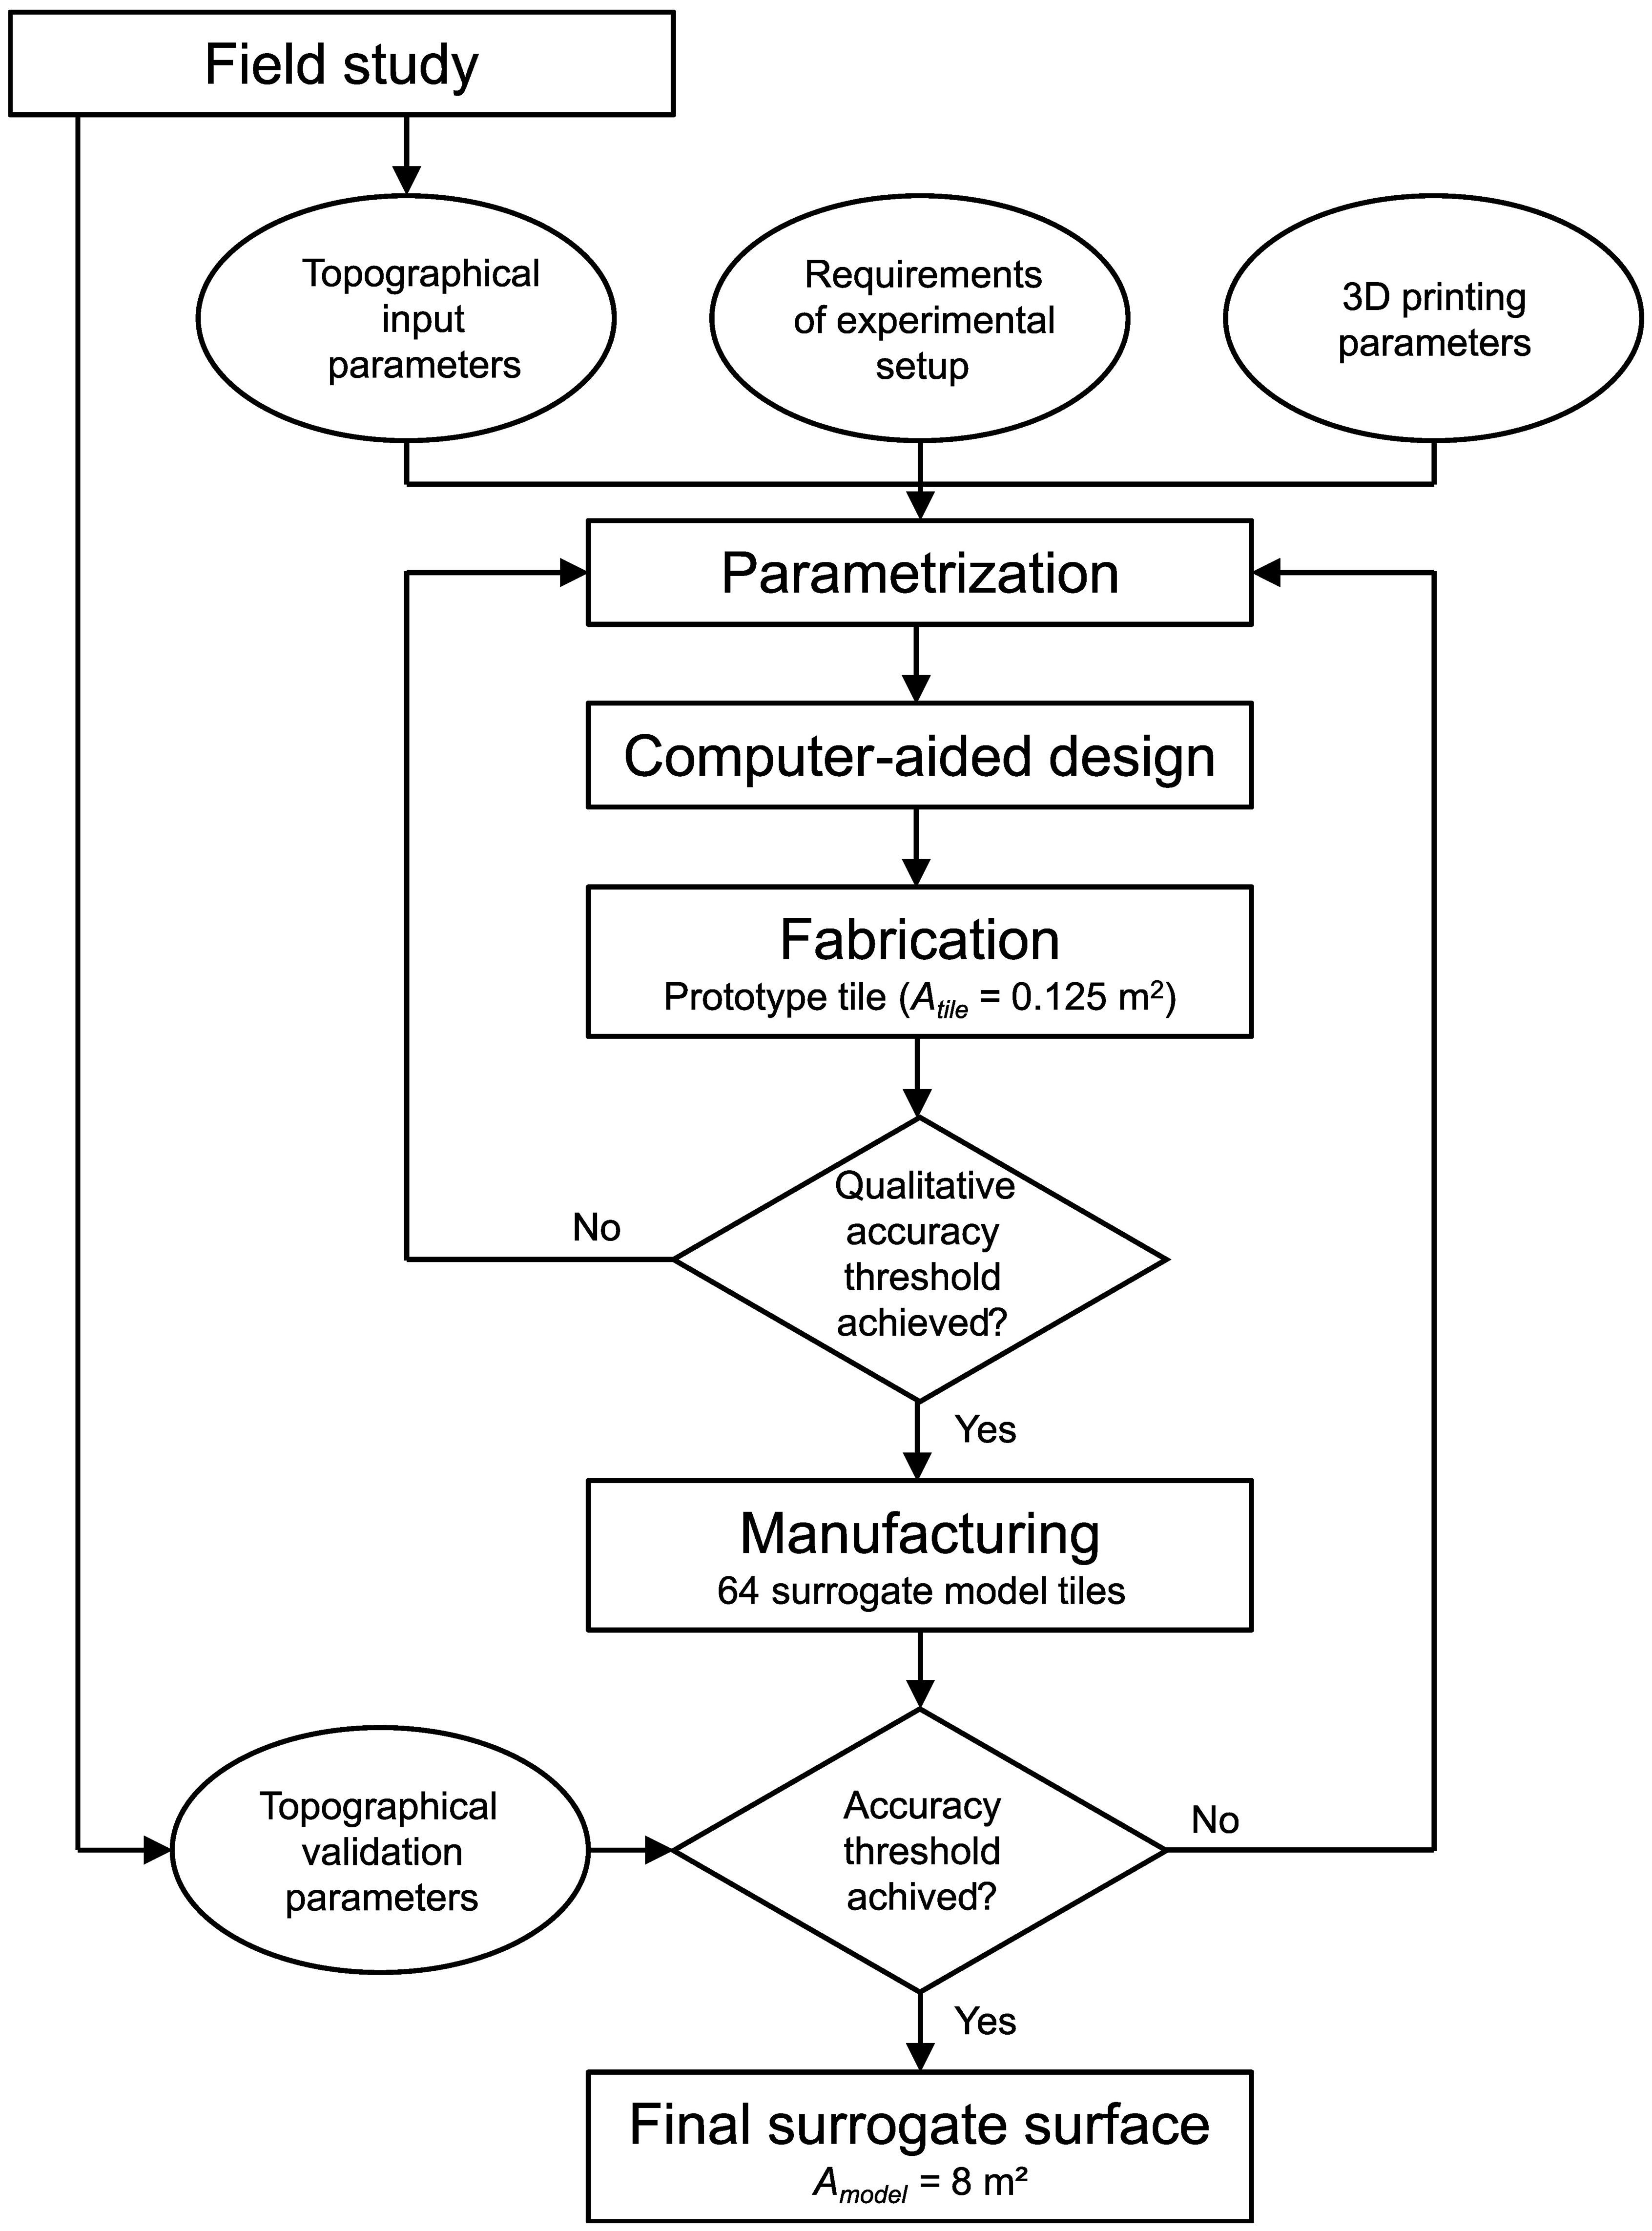
Figure 2 A schematic diagram of the workflow for developing and manufacturing generic surrogate models of coastal biogenic structures.
As the initial step, field studies have been conducted to determine topographical parameters. The topographical parameters have been separated into input parameters to serve as the baseline for the model development (i.e., abundance, shell cover, shell length, shell width, shell orientation in the xy-plane, and shell inclination) and a second set of parameters used for the validation (total and root-mean-square roughness heights, skewness, kurtosis, and porosity; see Section 2.4). Next, prototype tiles of the parameterized surrogate surfaces at a geometrical scale of 1:3 have been developed in an iterative process between parametrization, computer-aided design, and fabrication, considering 1) the topographical input parameters, 2) the requirements of the experimental setup, and 3) the possibilities and limitations of the 3D printer. Once a satisfactory level of dimensional accuracy, determined qualitatively, was achieved for a fabricated prototype tile, the surrogate models were manufactured in large numbers to cover the required surface areas for the experimental setup. Finally, the quality of the manufactured surrogate models was analyzed and compared to the validation parameters obtained in the field studies.
2.3 Field studies
The topographical roughness parameters that serve as the baseline for the model development and the validation have been collected as part of field studies for a M. gigas reef (Kaiserbalje) and a M. edulis bed (Nordstrand) in the central Wadden Sea, Germany, in the fall of 2020.
The oyster reef Kaiserbalje (mean coordinates: 53.6470116◦N, 008.2664760◦E; Figure 1) is situated on the intertidal between the Jade tidal channel and the outer Weser Estuary in the Lower Saxon Wadden Sea National Park. M. gigas is the habitat-defining ecosystem engineering species, while M. edulis individuals settle between the densely packed oysters. Detailed descriptions of the Kaiserbalje study are presented in Hitzegrad et al. (2022) and Hoffmann et al. (2023). This study chooses the class Central Reef of the structural classification introduced by Hitzegrad et al. (2022) as the focal structure, as it represents the structural class oyster reefs are predominantly formed of. The mussel bed Nordstrand (mean coordinates: 54.4465005◦N, 008.8728208◦E; Figure 1) is located on an intertidal flat west of the peninsula Nordstrand in the Schleswig-Holstein Wadden Sea National Park. M. edulis is the habitat-defining ecosystem engineering species, with very few M. gigas individuals (N ≤ 10 inds./m2).
Four topographical samples were collected at distinct locations within the oyster reef (OR) and the mussel bed (MB). The samples OR1 to OR3 are the same as those presented in Hitzegrad et al. (2022) (referred to as CR1 to CR3 in the original publication); OR4 has not been published before. High-resolution DEMs were generated using SfM photogrammetry and analyzed by applying spatial statistics (Nikora et al., 1998; Aberle and Nikora, 2006; Westoby et al., 2012; Leon et al., 2015). At each location, sections of the reef or bed surface (~1.5 m2) were systematically photographed (approx. 200 photographs) in a spiral motion, ensuring a high degree of subject overlap. After sorting and pre-processing the photographs (i.e., elimination of blurry photographs and color correction), DEMs were generated using Agisoft Metashape Professional (v. 1.7.3). The resulting high-resolution point clouds were scaled using three reference bars, which were positioned at the margins of the selected section during the sampling. The total and vertical root-mean-square errors are RMSEtotal = 0.6 – 3.3 mm and RMSEvertical = 0.4 – 3.0 mm. Subsequently, the point clouds were converted into meshes. To filter the underlying sediment topography from the oyster/mussel-related roughness, a non-uniform surface layer was formed after the exposed sediment topography was subtracted from the raw DEM in Rhinoceros 3D (v.6) and its scripting interface Grasshopper. Subsequently, the filtered DEMs were exported as rasterized point grids with a spacing of 2 mm. Finally, spatial statistics were applied in MATLAB R2023a by applying the Statistics and Machine Learning Toolbox. Probability density functions (PDFs) of the surface level elevations, z, and the corresponding statistical moments have been computed for each sample (see Section 3.1).
Additionally, the abundance N, as well as average shell length, l, and widths, w, were determined. For each oyster reef sample, NOR was determined visually from orthomosaics based on the DEMs (compare Hitzegrad et al. (2022)). Approx. 80 shells were measured to determine lOR and wOR. For the mussel bed, NMB, lMB, and wMB were determined differently. At twelve sample locations, randomly distributed over the mussel bed, all individuals protruding from the sediment surface in 0.25 × 0.25 m (0.0625 m²) sections were collected and measured. As M. edulis organize themselves in dense agglomerations separated by bare sediment, only the areas occupied by mussels were taken into account.
2.4 Surrogate model design
The surrogate models (.stl files) have been developed in an iterative process, refining the configuration of the surface parameters (see Section 3.2) with the parametric design tool Rhinoceros 3D (v.6) and its scripting interface Grasshopper. Parametric design tools allow the creation of 3D models with complex surface characteristics and adjustable variables, generating multiple design options with minimal input and easily modifying designs to accommodate changing requirements (Aish and Woodbury, 2005).
For both target surfaces, the generic surrogate models have been modeled using average parameters of the individual shells and the surface characteristics at the microscale, taken from the field studies’ results presented in Section 3.1 and the literature. As a baseline, an underlying planar sediment layer was defined. The sediment layer was populated with modeled shells with distinct abundances and arrangements. The shape of the shells was defined by four Non-Uniform Rational B-Splines (NURBS) with shell length l (for the oyster reef surrogate surface defined as the parts of the shells that is protruding from the reef structure), shell width, w, shell orientation, α, in the xy-plane, and shell inclination, φ, in the y-direction as variable parameters for each model, respectively. In the design process, the models and their parameters were adopted iteratively to optimize the fabricated surface. Hereby, the targets were 1) to optimize the shape of the shells, i.e., the depiction of the thin ventral margin of the oyster shells, and 2) to optimize the spatial arrangements.
The experimental setups, aiming to understand the dissipative effects of complex coastal biogenic structures on waves (not part of this work), required a surface area of Amodel = 8 m² of each surrogate model at a geometric scale 1:3. The dimensions of the building chamber of the particle bed 3D printer (see Section 2.5) determined that the surrogate surfaces were divided into 64 uniform and manageable tiles (L × W = 0.50 × 0.25 m; Atile = 0.125 m2) (see Section 2.5). Both the oyster reef tiles (ORT) and the mussel bed tiles (MBT) consist of a support structure with a thickness of 30 mm and the respective surrogate surface.
2.5 Manufacturing process
The surrogate model tiles were produced in a particle bed 3D printer (Progress Group) with the SCA process (Figures 3A, B). The particle bed consisted of sand with a maximum grain size of 581.5 µm and cement with a maximum grain size of 29.8 µm. The two components were mixed in a volumetric ratio of 60/40 (sand/cement). A rather fine sand was chosen to achieve a low surface roughness. A rather high cement content was chosen to provide high dimensional accuracy, as the hydration reaction of the cement reduces the water intrusion into the particle bed (Mai et al., 2022b). Furthermore, 1 wt.% methylcellulose was added to the particle bed, as it provides a high dimensional accuracy and maximizes the printed objects’ mechanical performance (Mai et al., 2022a). For each layer, a dry sand-cement mixture was applied with a 1.3 mm layer height, which was then compacted to 1 mm using a rotating roller to increase the mechanical performance of the produced components (Lowke et al., 2022) (Figure 3C). The water was applied with a discharge rate of 4 g/min (corresponding with 0.68 bar pressure in the 100 µm nozzles). The travel speed of the nozzles was adjusted to produce a water/cement ratio of 0.4 (w/c). The volume of the building chamber (L × W × H = 700 × 380 × 500 mm) defined the dimensions of the tiles and allowed for the consecutive production of seven tiles per print, eliminating the need for their removal from the surrounding medium after the production of each tile.
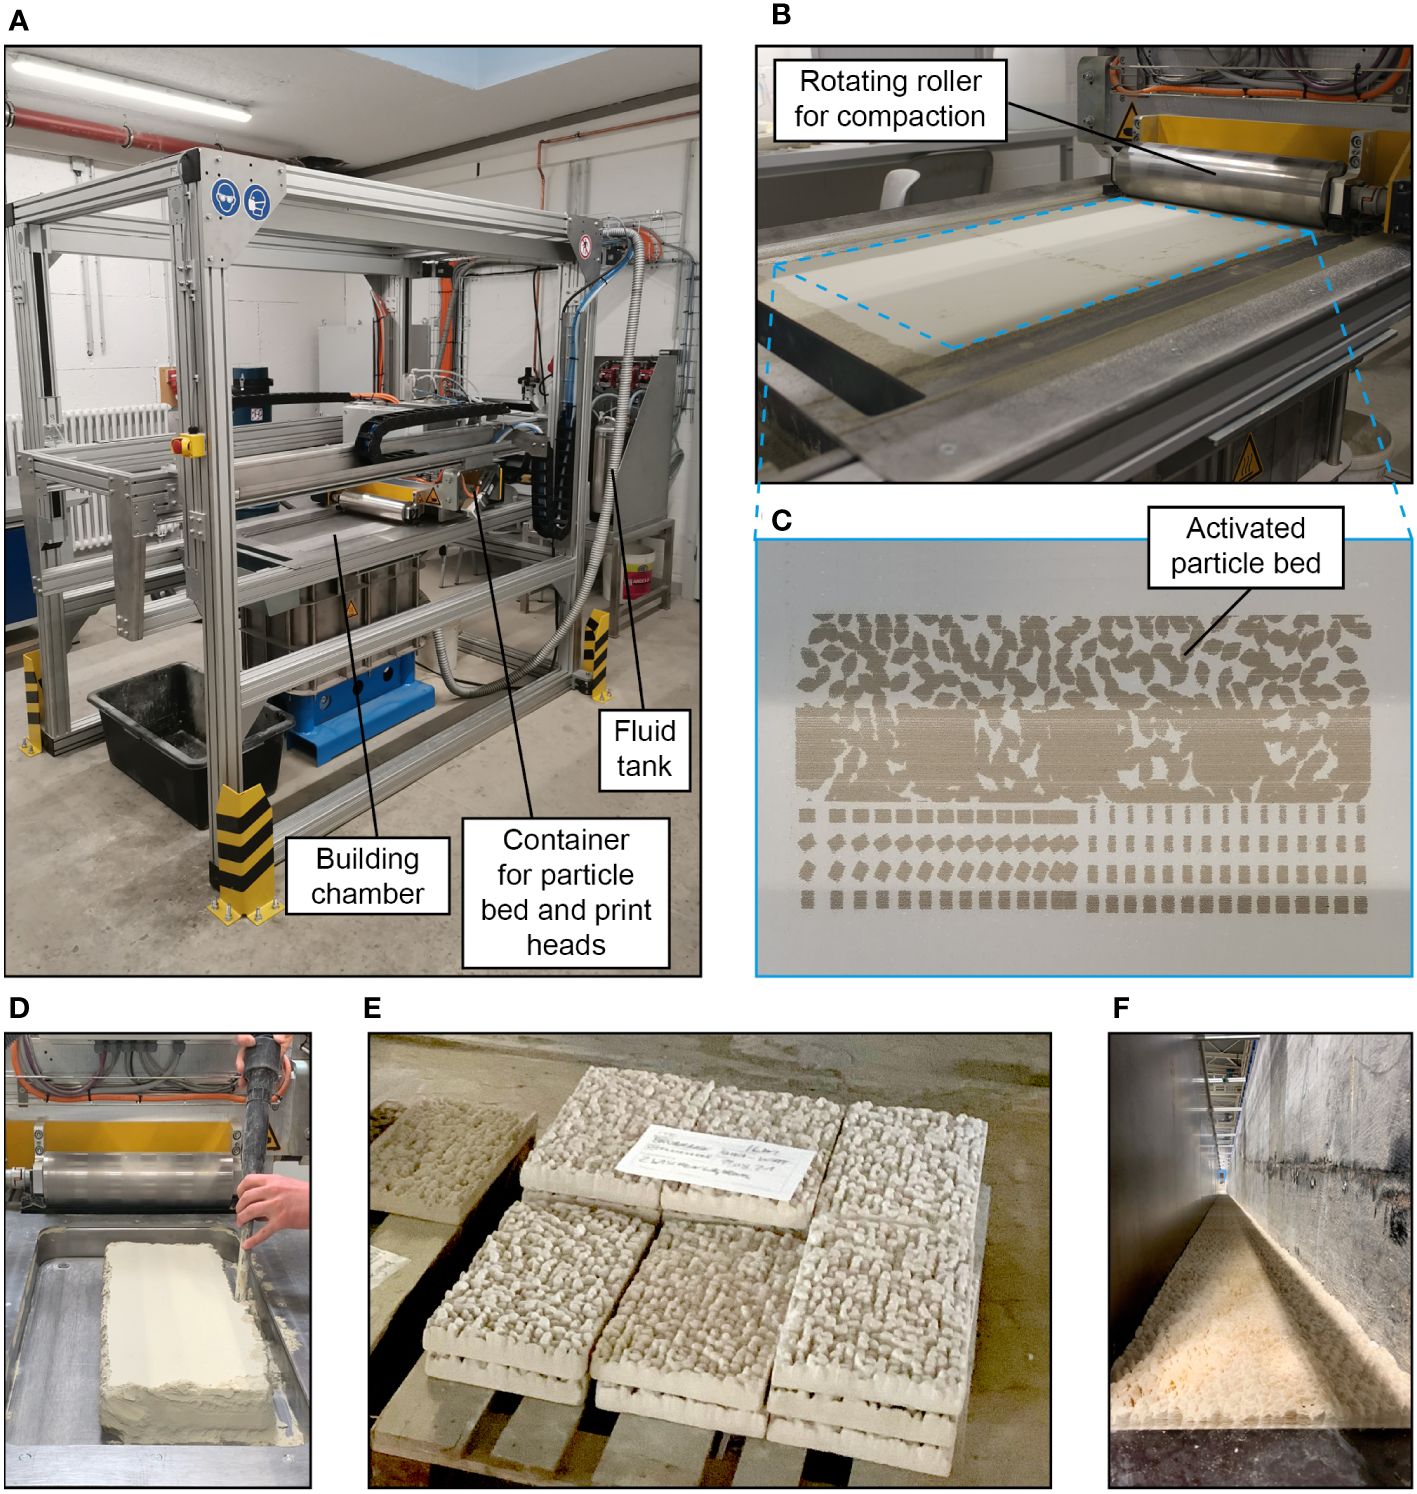
Figure 3 Photographs of the manufacturing process: (A) Overview of the particle bed 3D printer with Selective Cement Activation, (B) close-up of the building chamber for the particle bed, (C) close-up of the activated particle bed during the printing process, (D) preparation of a tile blank for post-processing, (E) manufactured oyster reef tiles, and (F) oyster reef surrogate surface (L × W = 16.0 × 0.5 m) positioned in wave flume.
After the fabrication process and an initial curing period of 30 min, the tile blanks, including residual compacted but unbound material between the roughness elements, were removed from the building chamber for post-processing (Figure 3D). The tile blanks were then cured in a dry environment for four to six days. Next, the unbound particles were removed in a de-powdering process. The surface structures were excavated using a high-pressure cleaner from a distance of 0.50 m, a faster and more accurate method than the typically used manual tools (archeological excavation tools, screwdrivers, and spatula). To ensure the discharge of unbound material from the gaps between the shells, the tiles were positioned upright during the cleaning process. The tiles were pressure cleaned twice and immersed in water for 10 min in between to ensure the removal of the deeply entrenched residues between the shells. Three oyster reef tiles (ORT15 – 17) were excavated with manual tools to evaluate the surface quality of the pressure-cleaned tiles. Finally, the tiles were submersed in water for two days to counteract potential contamination from floating cellulose particles and to enhance the chemical curing process (Herding et al., 2022).
3 Results
First, the in-situ topographical parameters, determined in the field studies to the oyster reef and the mussel bed, that served as input and validation parameters are presented. Then, the iterative process of the model development and the final parametrization are outlined. Next, the manufacturing quality is assessed. Finally, the topographical characteristics of the manufactured surrogate models are compared to those of the in-situ biogenic structures.
3.1 Topographical roughness parameters
Figure 4A shows the DEMs of the oyster reef and mussel bed samples obtained in the field studies (compare Section 2.3). The oyster reef samples exhibit a homogeneous surface of densely packed shells. The mussel bed samples show net-shaped patterns of dense agglomerations of individuals separated by bare sediment, typically found at the microscale. The oyster reef samples have an average shell length of lOR = 80 ± 5 mm and an average shell width wOR = 47 ± 12 mm. The mussel bed’s average shell length and width are lMB = 25 ± 5 mm and wMB = 12 ± 3 mm, respectively. The oyster reef’s average abundance NOR = 387 ± 37 inds./m2 is significantly lower than that of the mussel bed with NMB = 2263 ± 212 inds./m2 due to the distinct sizes of the two species.
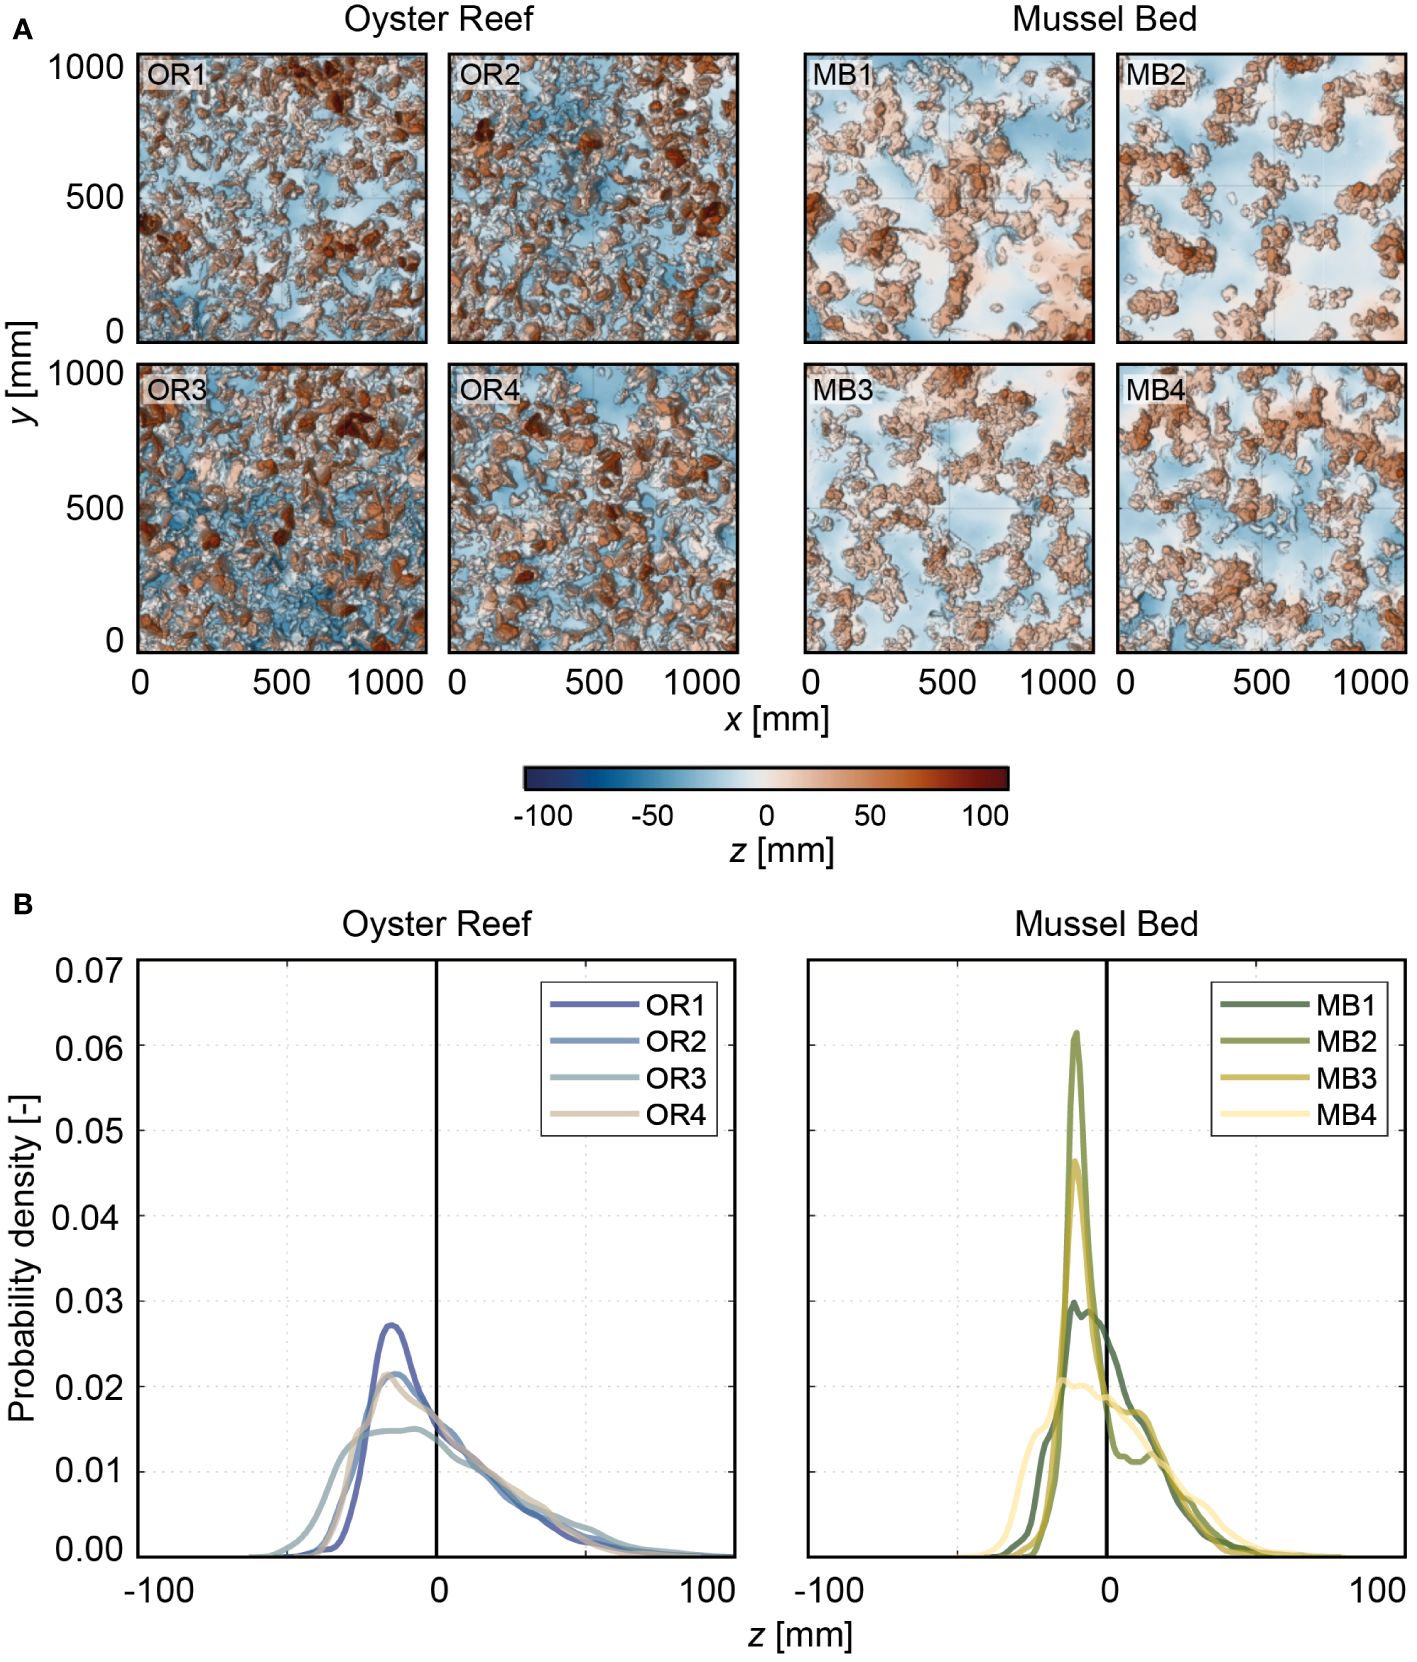
Figure 4 (A) Top-view visualizations of the digital elevation models (DEMs) sorted into oyster reef (OR; OR1-OR3 are the same as CR1-CR3 in Hitzegrad et al. (2022)) and mussel bed (MB). The x-, y-, and z-axis are in mm. The color scale (Crameri, 2018) indicates surface level elevations in z centered around the zero mean. The point of origin (x, y) = (0 mm, 0 mm) has been defined as the southwest corner of the section. All samples are oriented with north on top. (B) Histograms illustrating the probability density functions (PDFs) [-] of all samples distinguished into OR and MB. The different colors indicate the individual samples (Crameri, 2018).
Comparing the shape of the probability density functions and the associated topographical roughness parameters reveals further differences (Figure 4B, Table 1). The oyster reef exhibits higher roughness heights compared to the mussel bed, both for the total roughness height, kt, (99%-percentile minus the 1%-percentile of the surface level elevations) and the root-mean-square roughness height, krms. For the oyster reef, the average total roughness height is kt,OR = 101 ± 10 mm, and the average root-mean-square roughness height is krms,OR = 23 ± 2 mm, while for the mussel bed, kt,MB = 70 ± 6 mm and krms,MB = 16 ± 1 mm. The PDFs of the oyster reef samples exhibit bell-shaped distributions with peak values around 0.02. The distributions are right-skewed (SkOR = 0.8 ± 0.2), as expected for surfaces with protruding roughness elements, i.e., the oyster shells (Chung et al., 2021). The kurtosis KuOR = 3.4 ± 0.4 reveals slightly more pronounced tails than a normal distribution, which can be attributed to the right tail reflecting the protruding shells and their thin ventral margins. Conversely, the PDFs of the mussel bed samples exhibit bimodal distributions with two peaks. The prominent peaks in the PDFs are situated below the zero mean with peak values between 0.02 and 0.06 and secondary peaks above the zero mean with peak values between 0.010 and 0.025. The two distinct peaks can be attributed to the clear separation in areas with bare sediment (53 ± 10% of the surface area) and agglomerations of mussel shells (46 ± 10% of the surface area), reflecting the peaks below and above the zero mean, respectively. Similar to the oyster reef samples, the distributions are right-skewed with SkMB = 0.8 ± 0.2 due to the protruding mussel agglomerations, and the kurtosis KuMB = 3.4 ± 0.3 reveals slightly heavier tails than a normal distribution. The bulk porosity (Φbulk,OR = 0.66 ± 0.01 and Φbulk,MB = 0.66 ± 0.04) exhibits similar average values for both surfaces types.
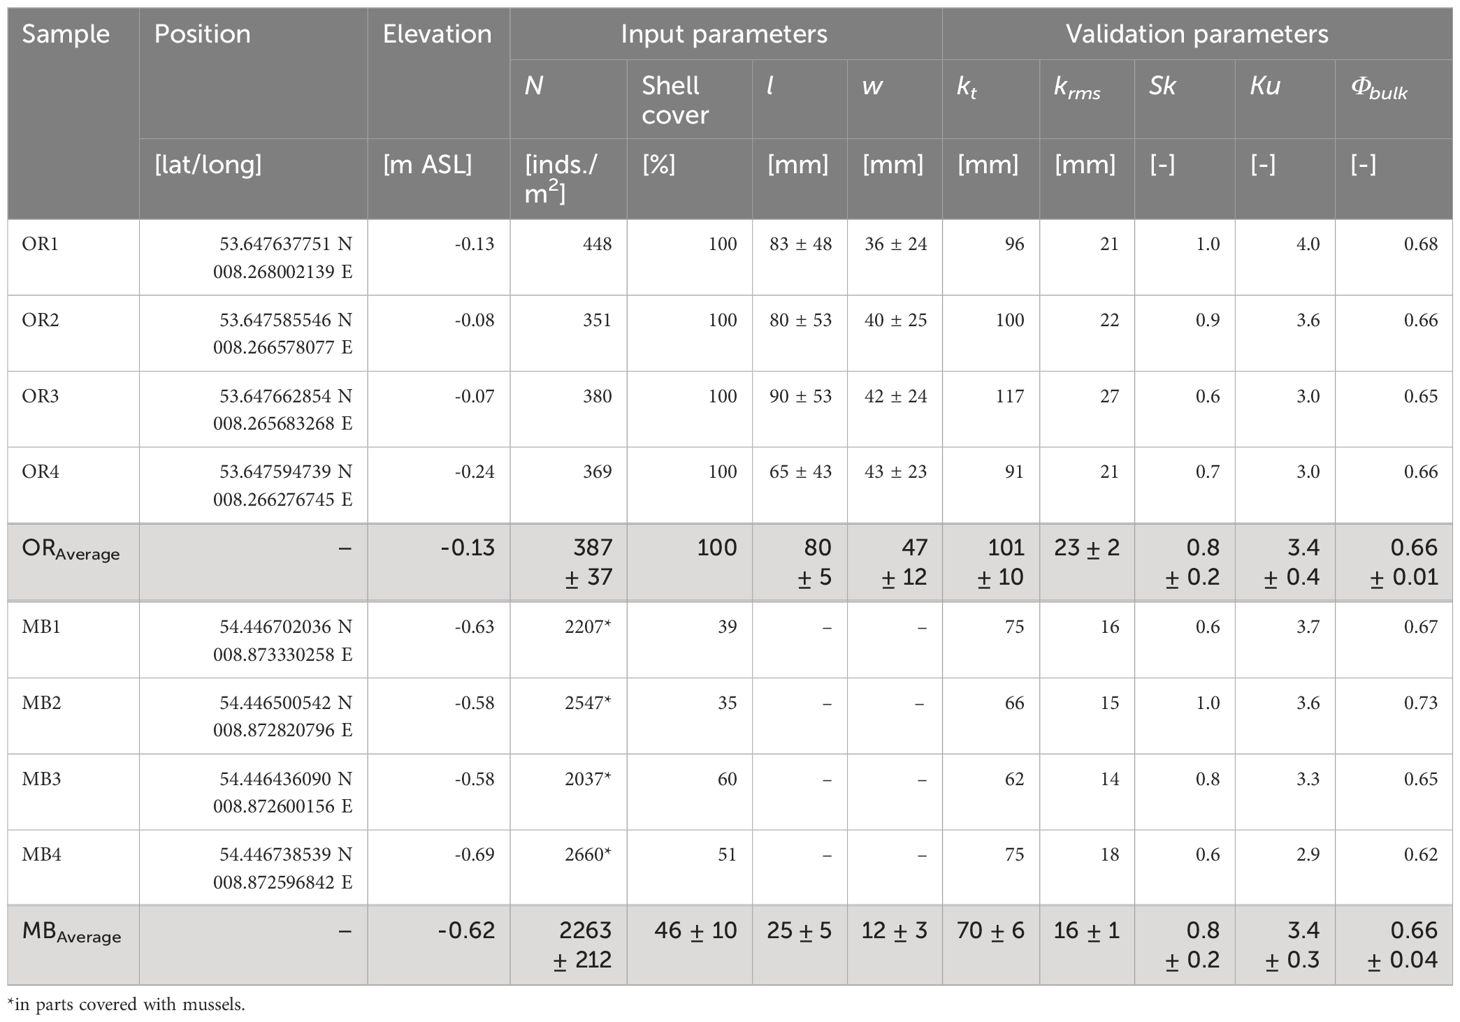
Table 1 Summary of the statistical analysis of the field data for the oyster reef (OR) and mussel bed (MB) samples, sorted into input and validation parameters for the surrogate model design, where N is the abundance, l is the shell length, w is the shell width, kt is the total roughness height, krms is the root-mean-square roughness height, Sk is the skewness, Ku is the kurtosis, and Φbulk is the bulk porosity.
3.2 Surrogate model development
To develop the oyster reef surrogate surface, three iterations of 3D modeling and fabrication of prototype ORTs were undertaken to optimize the design for the printing process (Figure 5A).
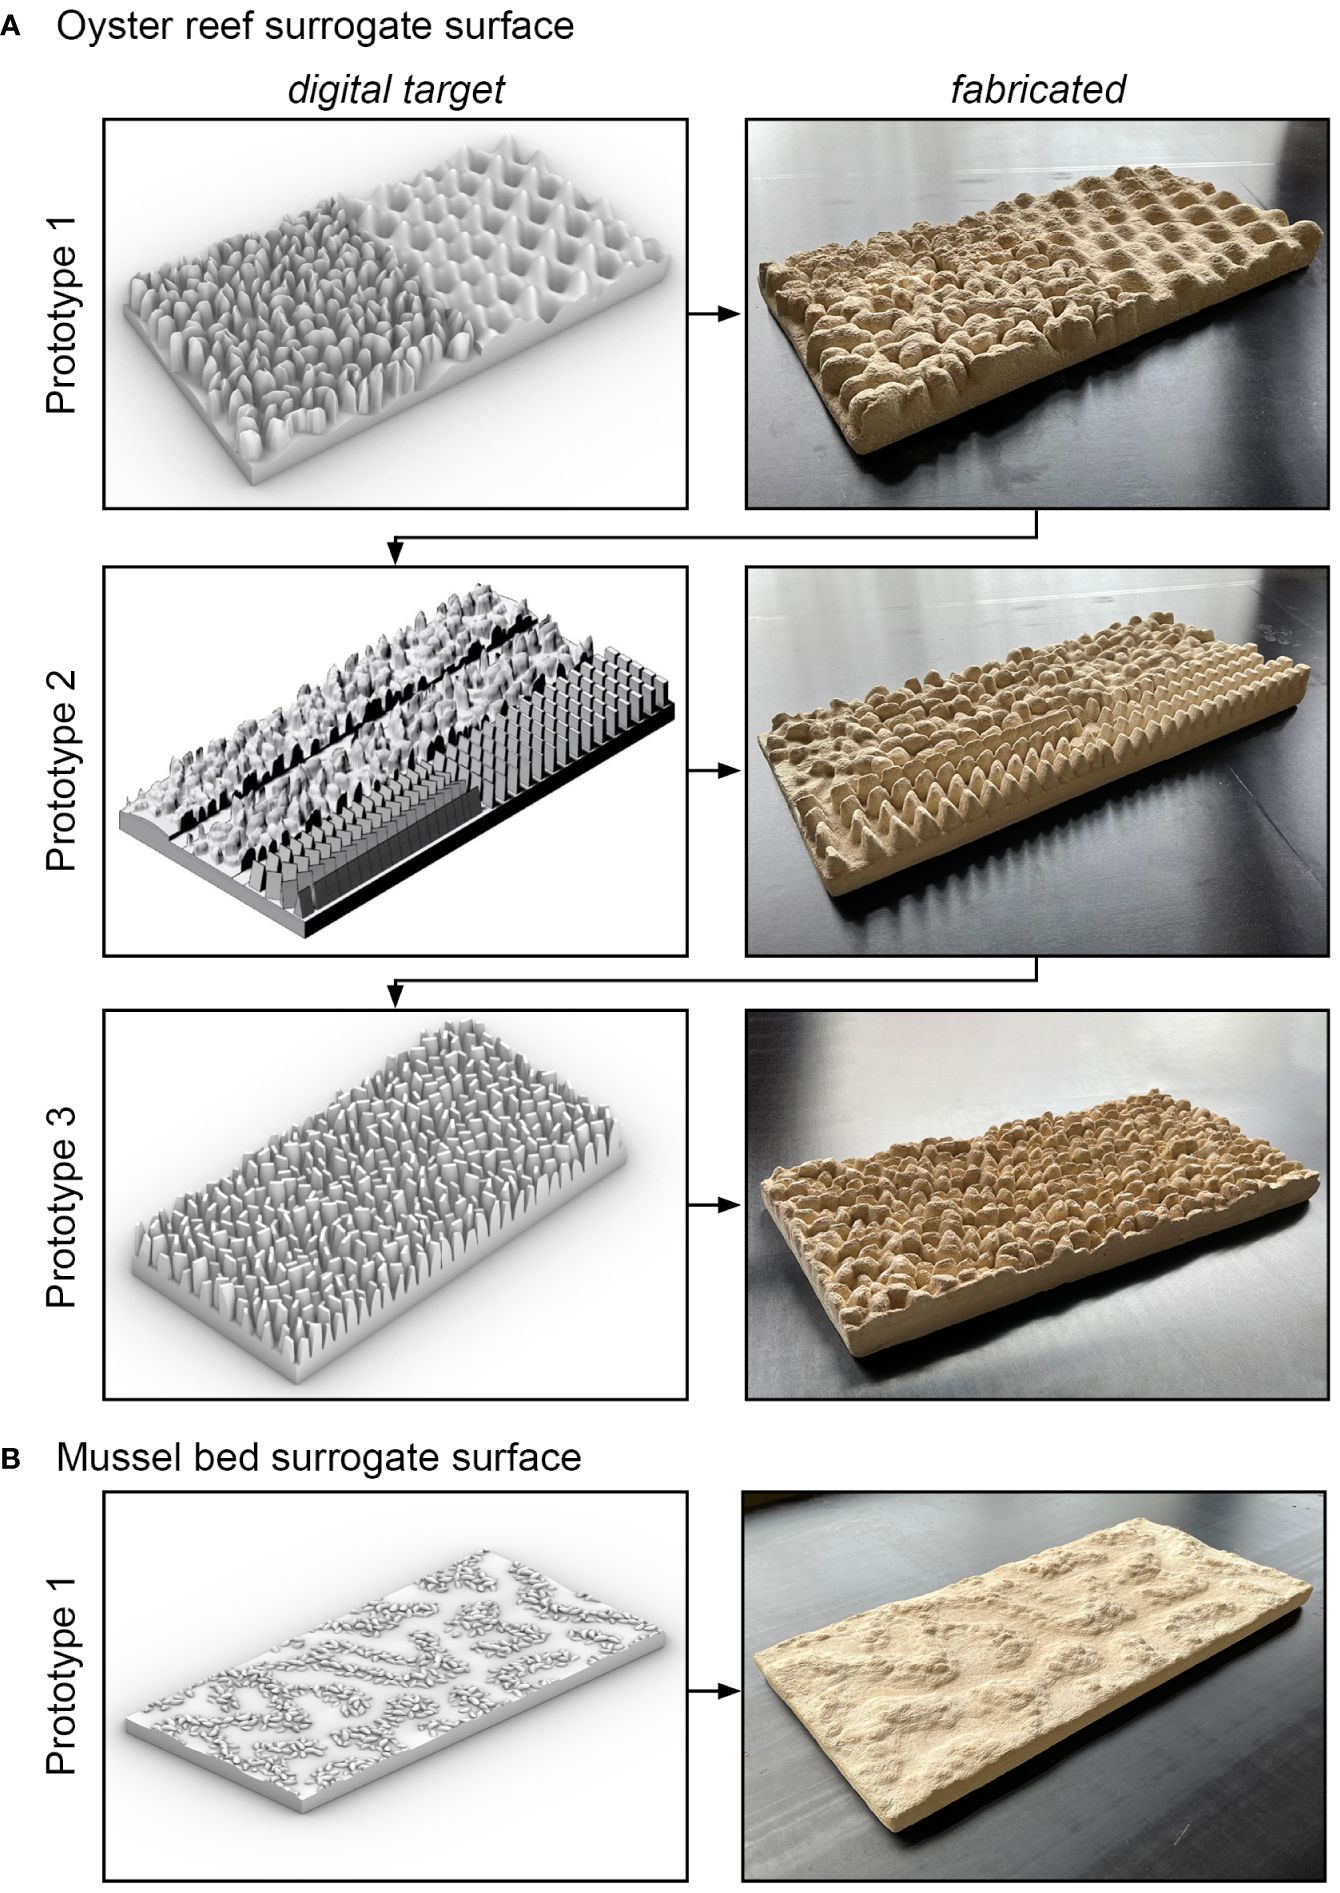
Figure 5 Visualizations and photographs of the digital target and fabricated prototype tiles illustrating the iterative surrogate model development for (A) the oyster reef surrogate surface and (B) the mussel bed surrogate surface.
In the first iteration, an attempt was made to mimic real oyster shells and spatial arrangement closely. The modeled shell shape included the irregular, rugged shell morphology and the thin ventral margin, which are known to influence the hydraulic roughness of oyster reefs significantly (Hitzegrad et al., 2024). The shells were arranged vertically on a regular grid with varying l and w, and without open sediment spaces. A less complex geometry consisting of overlaying sinusoidal shapes was realized on half of the tile as a reference surface with lower complexity. A qualitative assessment of the fabricated prototype tile with the digital target prototype tile revealed that the particle bed 3D printing technique, in combination with the material used here, could not accurately reproduce the thin ventral margins of the oyster shells. This limitation led to the fabrication of rounded shell shapes with significantly reduced shell length compared to the digital target prototype tile. Additionally, removing the excess powder from the gaps between individual shells was challenging due to the dense arrangement, the selected shell widths, and shell orientations, resulting in clumping in some instances.
Consequently, a second iteration was initiated, wherein half of the tile’s surface area consisted of cuboids narrowing towards the top with varying ventral margin widths (t = 0.5 – 3.0 mm) to determine the thinnest feasible margin. In the other half of the tile, the original shell shape was positioned with widened shell margins. The orientations and spacings of these elements were also varied to optimize the arrangement. The fabricated prototype tile illustrated that shells with ventral margin widths of t ≥ 2 mm are printable with acceptable loss in the height and formation of a relatively sharp margin. Furthermore, these elements could be de-powdered without excessive breaking of shell elements. Comparing the de-powdering process between the regularly spaced and randomly positioned elements showed that de-powdering is more complicated, time-intensive, and less accurate for a random arrangement.
In the third iteration, a simplified version of the close-to-nature shell shape and spatial arrangement was realized (parameters listed in Table 2). The complexity of the oyster shells was simplified by neglecting the ribbed shell morphology. Based on the second iteration’s results, the shells’ ventral margins were widened to a fabricable thickness of t = 2 mm. The shells were arranged in a honeycomb pattern with maximum widths of wOR,model = 16 mm, to impede material clumping during the de-powdering in the gaps between shells despite the high abundance. At the prototype scale, an abundance of NOR,prototype = 400 inds./m2 was realized, similar to the average abundance at the oyster reef (NOR = 387 ± 37 inds./m2). The shells were positioned in a honeycomb pattern with shell widths of wOR,prototype = 40 ± 10 mm, and shell length of lOR,prototype = 80 ± 20 mm, in agreement with in-situ M. gigas (compare Sections 2.1 and 3.1). Notably, for the development of the oyster reef surrogate surface, the shell length is defined as the part of the shell that protrudes from the reef structure. The shell rotation α is varied randomly, and the y-inclination is varied with a maximum of φ = ± 10°. Each digital target prototype tile, with a length scale 1:3, consists of 450 individuals with lOR,model = 27 ± 7 mm, and wOR,model = 13 ± 3 mm (Figure 6A). To ensure the formation of a continuous pattern, the marginal shells of each tile were truncated and mirrored with identical individual parameters on the opposite side. The third fabricated prototype tile revealed an acceptable dimensional accuracy of the shells’ ventral margins and the gaps between the shells, determined qualitatively, allowing for the manufacturing of the 64 oyster reef tiles to cover the necessary 8 m2 of surrogate surface (Figures 3E, F). As the manual process to de-powder the tiles proved to be time-consuming and prone to breaking of individual shells, a high-pressure cleaning (ORT01 – ORT14) was developed. Furthermore, the high-pressure cleaning yields a more uniform de-powdering in the gaps between shells. As the pressure-cleaning yields better surface characteristics and a significant time saving, it was applied to the remaining tiles.
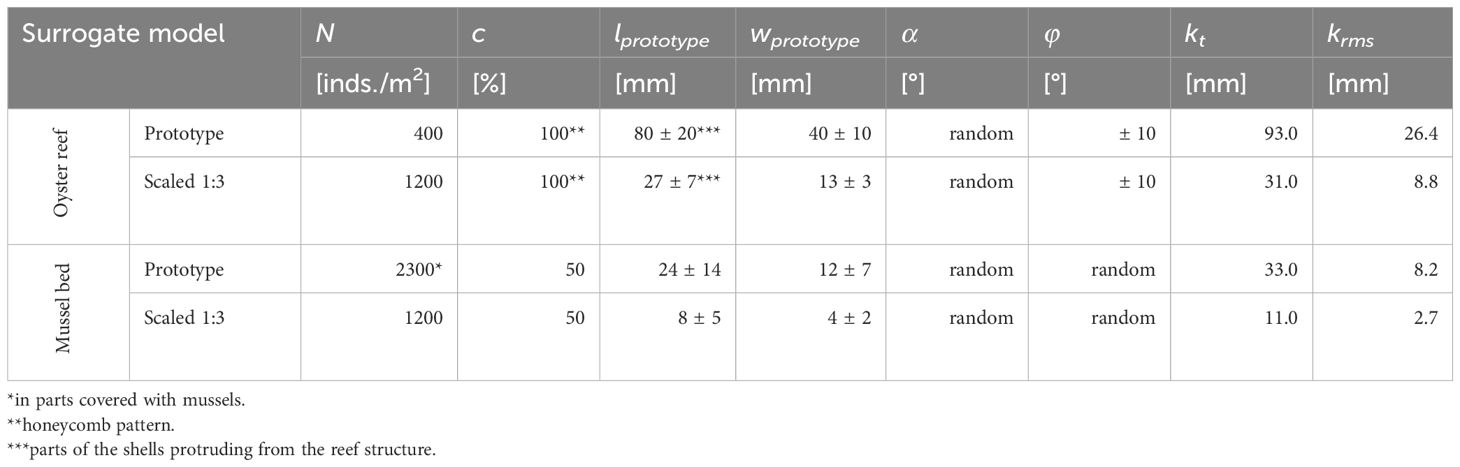
Table 2 Parameters defining the parameterized digital models of the mussel bed and the oyster reef (prototype and scaled 1:3), where N is the abundance, c is the coverage, lprototype and wprototype are the length and width of the shells, α is the shell rotation in the xy-plane and φ is the y-inclination of the shells.
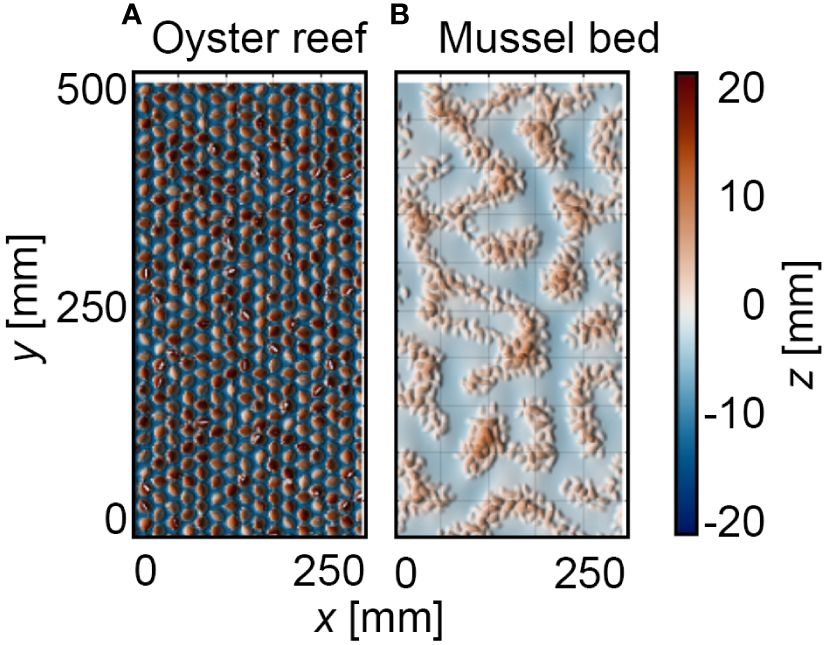
Figure 6 Top-view visualizations of the digital elevation models (DEMs) of (A) the digital target oyster reef and (B) mussel bed tiles. The x-, y-, and z-axis are in mm. The color scale (Crameri, 2018) indicates surface level elevations z centered around the zero mean.
The surrogate model development of the mussel bed surface differed due to the simpler geometry of the mussel beds and the insights gained from the design process of the ORT (Figure 5B). Thus, only a single iteration of parametrization, computer-aided design, and fabrication of a prototype tile was necessary. A surface with 50% mussel coverage and a net-shaped arrangement of the mussel agglomerations at the microscale was developed. A generic pattern is realized by applying the Cahn-Hilliard equation for phase separation, as proposed by Liu et al. (2013), to model the self-organizing spatial patterns at the microscale. Therefore, on a rectangular grid of 200 cells, random data (varying either -1 or 1) was distributed. Then, the Cahn-Hilliard equation (Sbalbi, 2020) was applied, which reads:
where c = 0.5 is the concentration (relation between cells with -1 and 1), D = 10 is the diffusion coefficient, is the length of transitional regions between domains. A total of 10,000 iterations were conducted for a stable segregation to establish by applying Equation (1). The resulting pattern was manually adjusted using Adobe Photoshop (v. 22) to fit the tile’s dimensions and ensure a continuous pattern with the adjacent tiles. Subsequently, the mussel-covered area was populated with overlapping mussel shells and random α and φ to mimic the dense agglomerations. At the prototype scale, the shell parameters (compare Table 2) were varied with hMB,prototype = 24 ± 14 mm, and wMB,prototype = 12 ± 7 mm, similar to in-situ M. edulis. Within the mussel-covered surface area, an abundance of NMB,prototype = 2300 inds./m2 (average abundance of the mussel bed: NMB = 2263 ± 212 inds./m2) random orientation in x-, y-, and z-directions of each shell was realized. The digital target prototype tile is populated with approx. 850 mussel shells with lMB,model = 8 ± 5 mm and wMB,model = 4 ± 2 mm (Figure 6B). As a satisfying level of detail was reached in the first fabricated prototype tile, the parametrization could be concluded, and the manufacturing of the 64 mussel bed tiles (MBT) required 8 m2 of surrogate surface was conducted.
3.3 Surface characteristics of the manufactured surrogate models
To assess whether the accuracy threshold of the manufactured surrogate surfaces had been achieved (Figure 2), DEMs of both surrogate surface types were generated and utilized to derive topographical roughness parameters and determine the dimensional accuracy relative to the digital target surface. Specifically, DEMs were generated for 17 ORTs (14 high-pressure-cleaned and three manually-cleaned tiles) for the oyster reef surrogate surface and for five MBTs for the mussel bed surrogate surface by applying a similar procedure to the field data collection (compare Section 2.3). DEMs of three to five surrogate model tiles were generated at once by closely positioning them on a level ground (~ 10 m2) and trimming the point clouds for each representative model tile in the post-processing. The resulting dense clouds per model tile (A = 0.125 m2) had, on average, 500,000 data points with RMSEtotal = 1.0 – 1.4 mm and RMSEvertical = 0.6 – 1.2 mm. The point clouds were aligned with the digital models using the Iterative Closest Point (ICP) algorithm within the CloudCompare software (v2.13 alpha) to assess the discrepancy between the point cloud and the digital fabrication model. Finally, rasterized point clouds with a point spacing of 2 mm (Figure 7) were exported for analysis using spatial statistics in MATLAB R2023a.
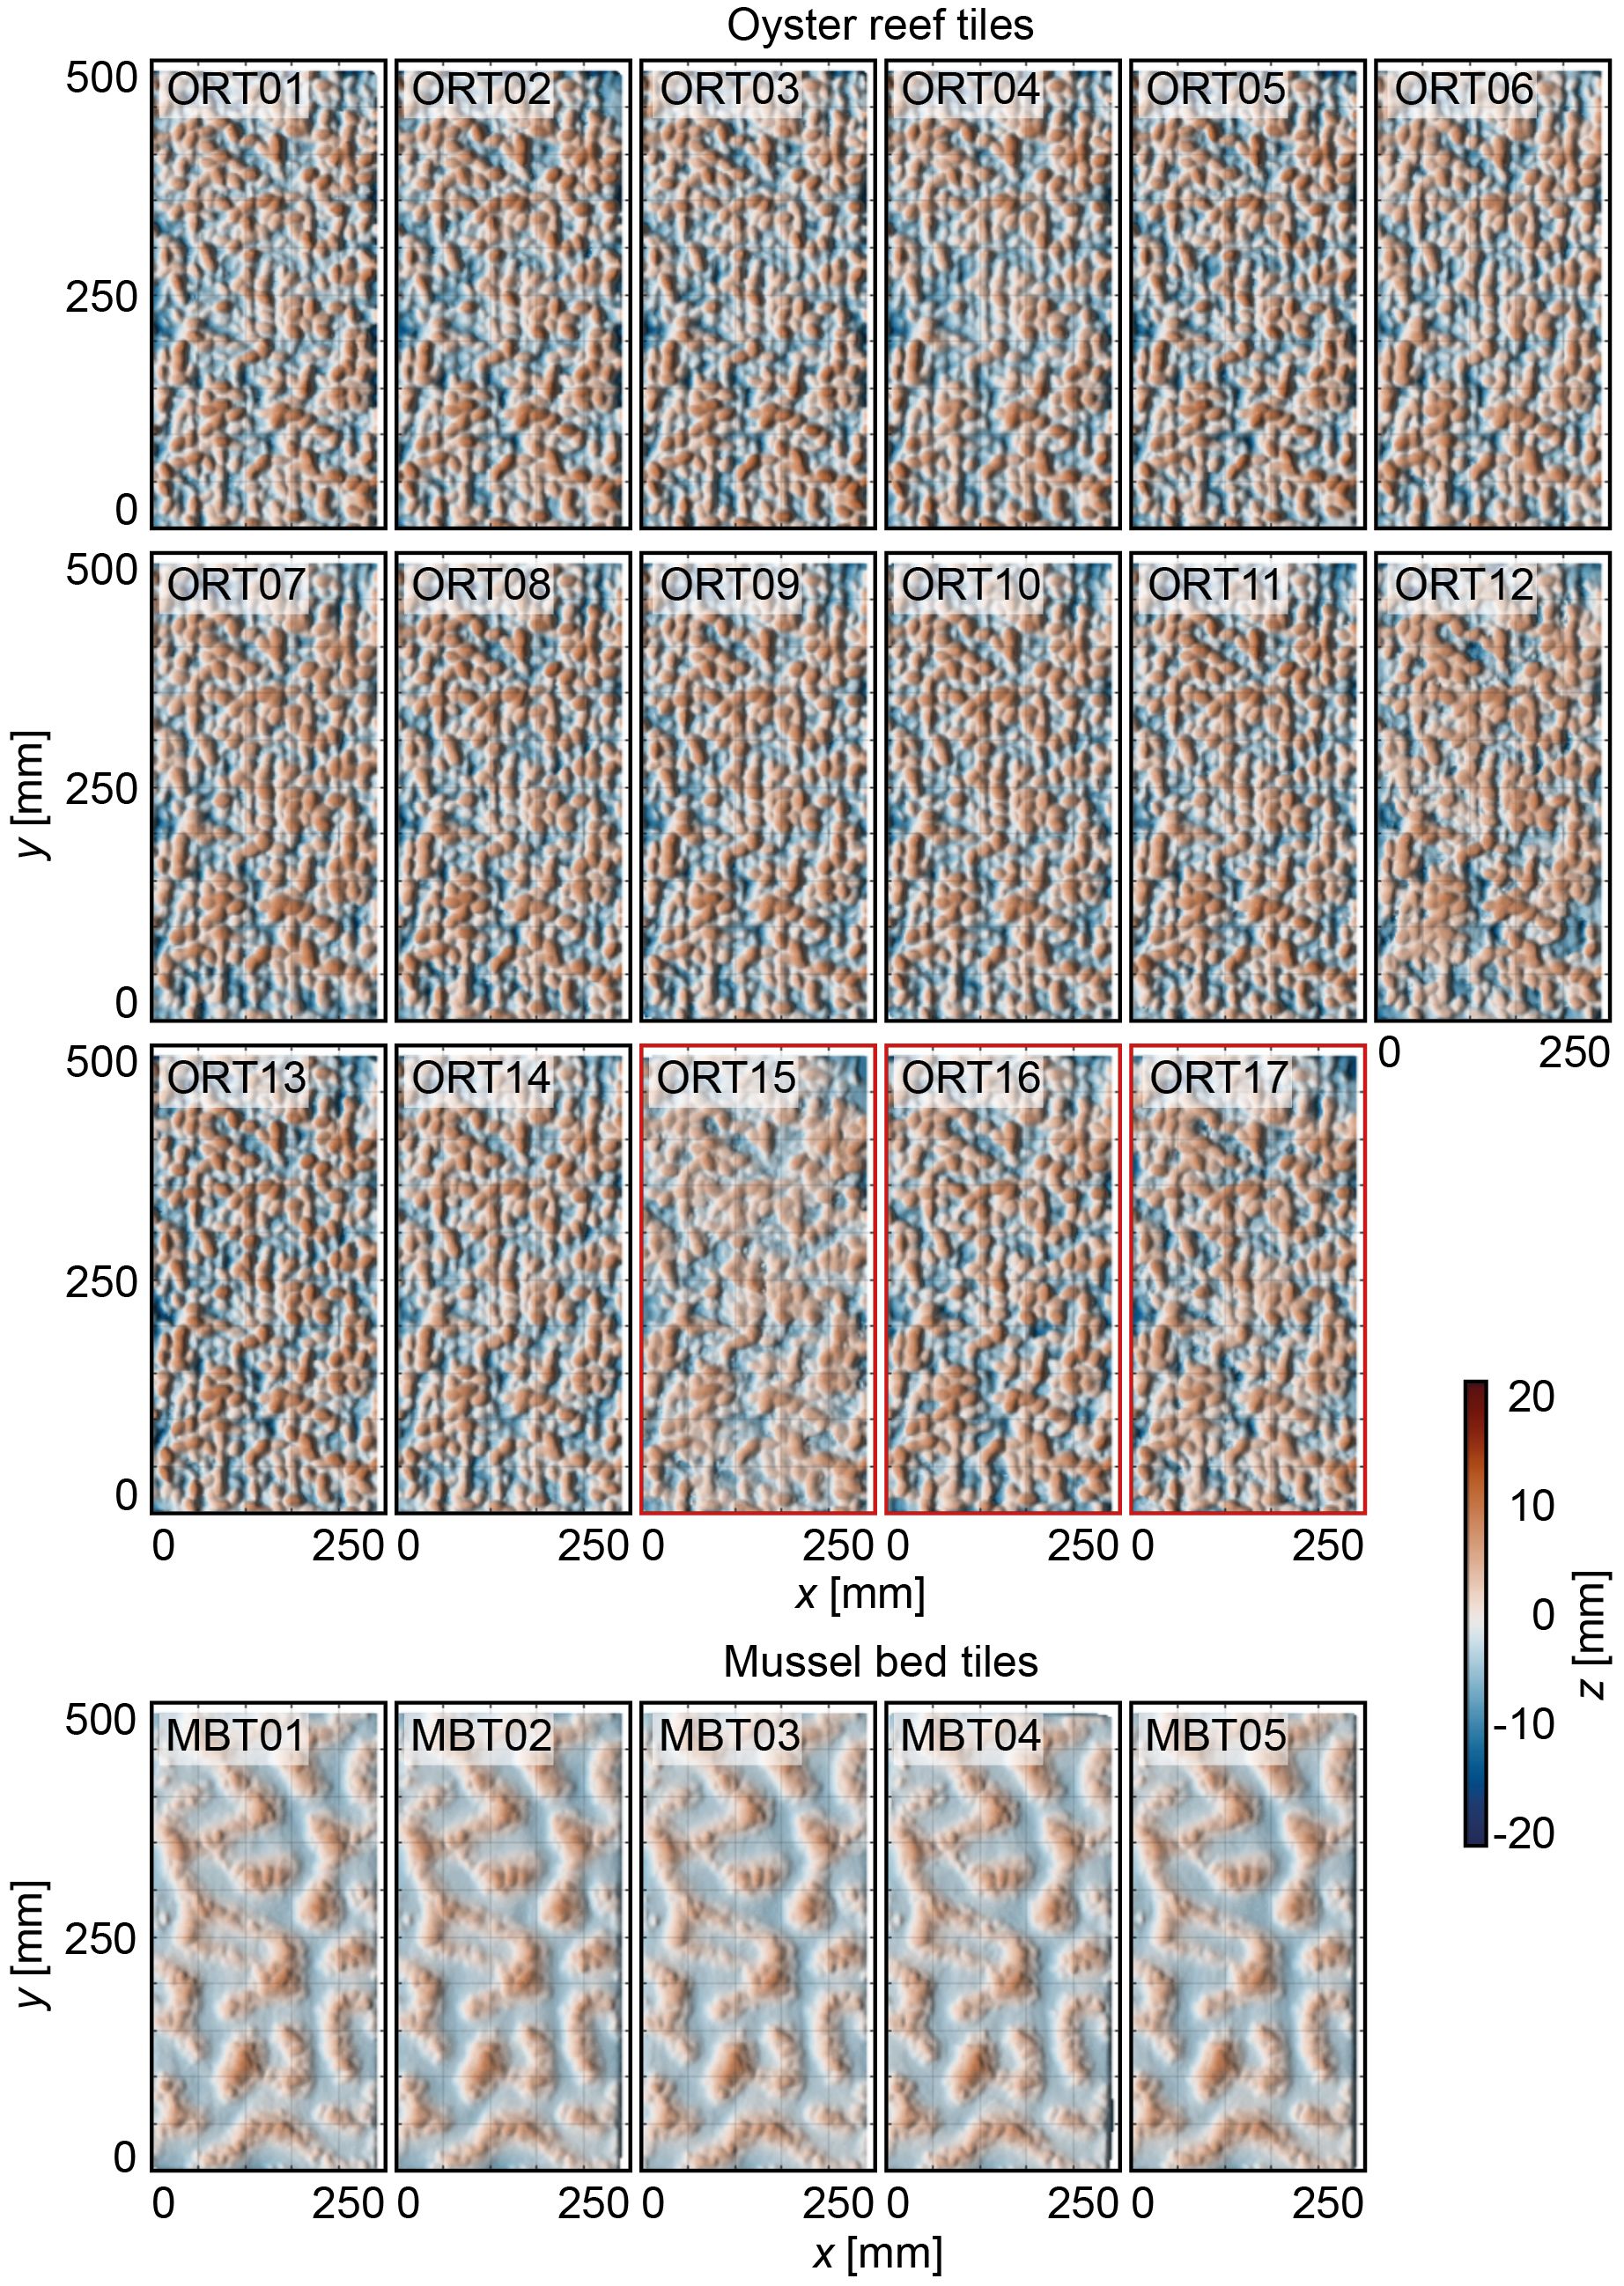
Figure 7 Top-view visualizations of the digital elevation models (DEMs) of the 17 oyster reef tiles (ORTs) and five mussel bed tiles (MBTs), respectively. The x- and y-axis are in mm. The color scale (Crameri, 2018) indicates surface level elevations z [mm] centered around the zero mean. ORT15 – ORT17 (red outlines) have been manually de-powdered.
The distributions of the surface level elevations of both surrogate model tile types are shown in Figure 8 (individual statistical parameters are listed in Table 3). Comparing the shapes of the PDFs reveals virtual overlap for the individual ORTs and MBTs, respectively. Only one of the ORTs (ORT15) illustrates a significant deviation in the shape of the PDF, which is one of the hand-cleaned samples. The average roughness heights of the ORTs are kt,ORT = 17.3 ± 1.4 mm and krms,ORT = 3.9 ± 0.3 mm. For the mussel bed tiles, the average roughness heights are kt,MBT = 10.8 ± 0.2 mm, and krms,MBT = 2.5 ± 0.0 mm. Thus, the standard deviations of the kt and krms are in the same order of magnitude as the inherent RMSE of the DEMs. The ORTs’ PDFs are bell-shaped (Sk = -0.2 ± 0.1) with peaks around the zero mean and peak values of 0.8 ± 0.1. The kurtosis Ku = 2.7 ± 0.2 is slightly below 3.0 (equal to the normal distribution). The bulk porosity is Φbulk,ORT = 0.34 ± 0.03. The distributions of the MBTs are slightly right-skewed (Sk = 0.4 ± 0.0), with the peaks below the zero mean and peak values around 0.175 ± 0.025. Like the ORTs, the kurtosis is Ku = 2.7 ± 0.0, slightly below 3.0. Near the zero mean, a slight dent in the shape of the PDFs is visible, indicating the separation between bare sediment and mussel-covered surface area. The bulk porosity of the MBTs is Φbulk,MBT = 0.50 ± 0.02. Thus, the statistical analysis confirms the high repeatability of the surface characteristics of the particle bed 3D printing with SCA. These results indicate that particle bed 3D printing with SCA is a suitable method to manufacture substantial quantities of surrogate model tiles with complex surfaces with little deviations in the printing quality.
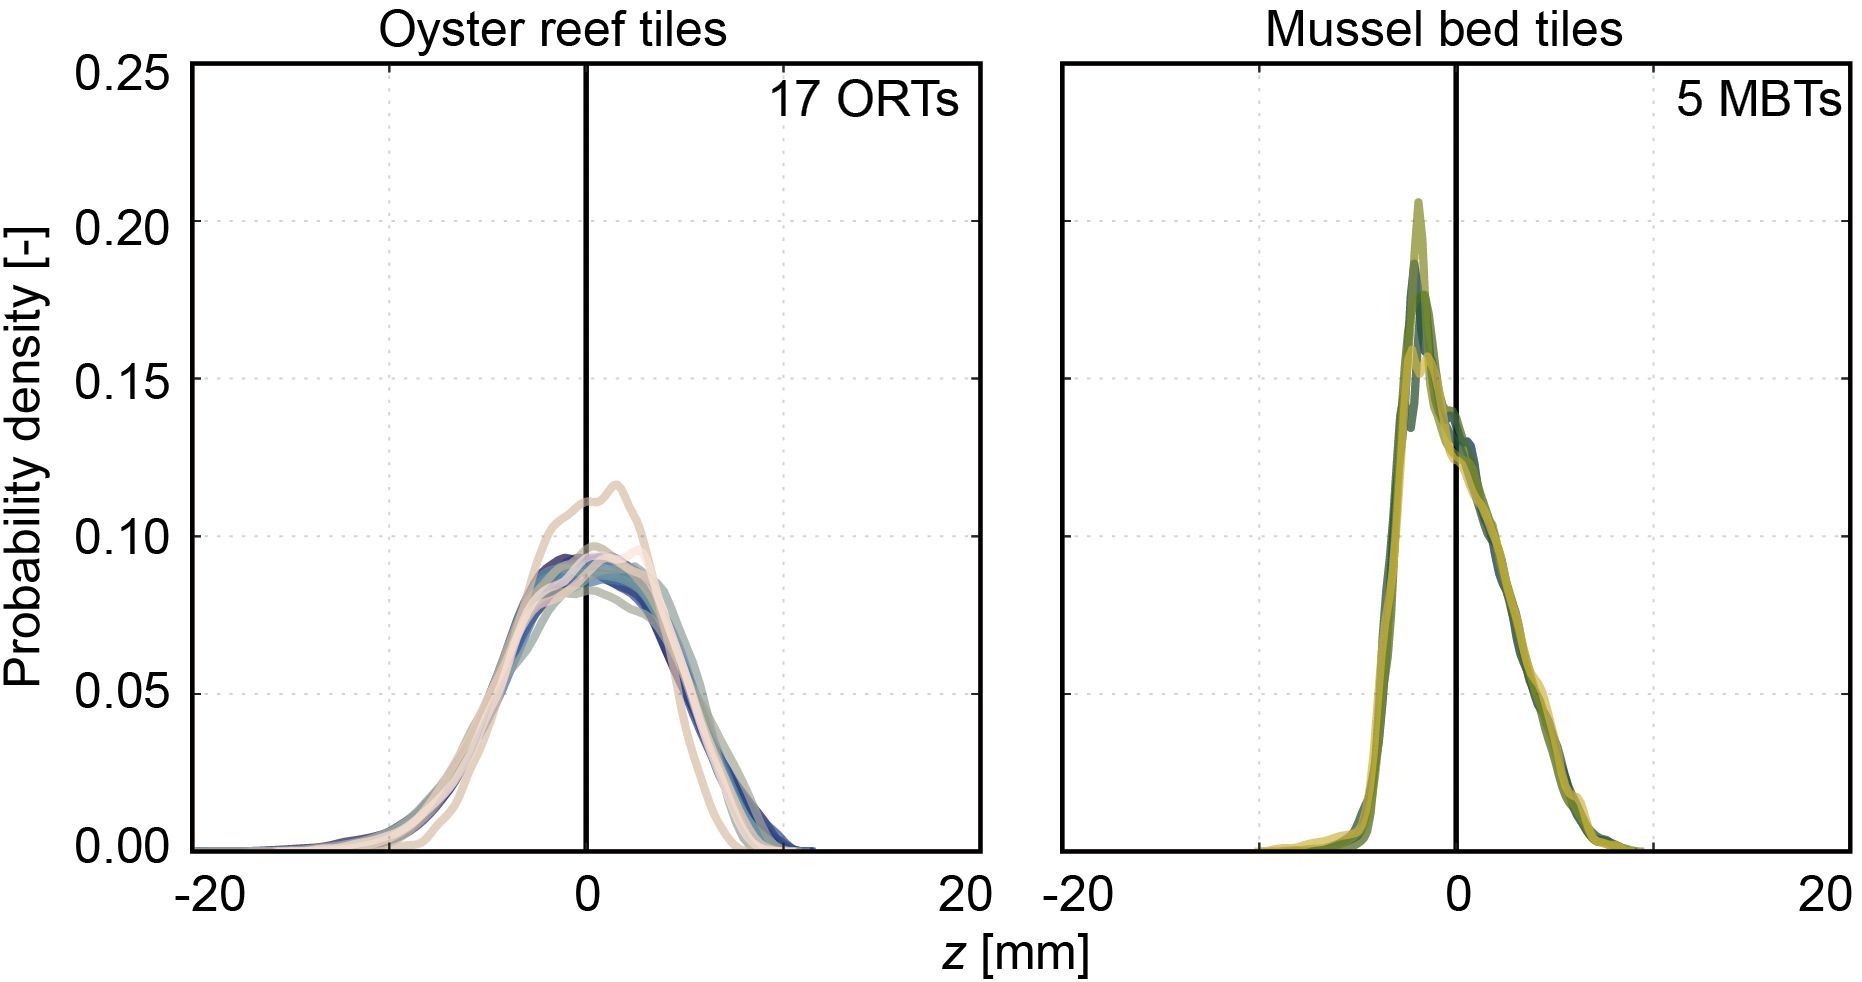
Figure 8 Histograms based on the surface level elevation z [mm] illustrating the probability density functions (PDFs) [-] of the 17 oyster reef tiles (ORTs) and the five mussel bed tiles (MBTs), respectively. The PDFs are centered around the zero mean. The colors indicate the individual samples (Crameri, 2018).

Table 3 Summary of the statistical analysis of the surface distributions of the surrogate model tiles, where kt is the total roughness height, krms is the root-mean-square roughness height, Sk is the skewness, Ku is the kurtosis, Φbulk is the bulk porosity.
3.4 Comparison to digital target models
The surface characteristics of the manufactured surrogate model tiles show deviations from their respective digital target tile to differing degrees for the oyster reef and the mussel bed surrogate surface (see Tables 2, 3). For the oyster reef surrogate surface, the roughness heights kt and krms of the ORTs (kt,ORT = 17.3 ± 1.4 mm and krms,ORT = 3.9 ± 0.3 mm) are 44% and 55% lower than those of the digital model (kt,ORT,digital = 31 mm and krms,ORT,digital = 8.8 mm), respectively. In contrast, for the mussel bed surrogate surface, kt and krms of the MBTs (kt,MBT = 10.8 ± 0.5 mm and krms,MBT = 2.5 ± 0.0 mm) and the digital model (kt,MBT,digital = 11.0 mm and krms,MBT = 2.5 ± 0.0 mm) yield deviations of less than 2% and 8%, respectively. The deviation of kt,MBT from kt,MBT,digital is in the same order of magnitude as the accuracy of the DEMs.
Figure 9 illustrates the distribution of the deviations of the surface level elevations, Δz, of the manufactured surrogate model tiles from the digital target tile, calculated with the Cloud2Mesh algorithm in CloudCompare v.2.13. For the oyster reef surrogates, a surface area of 34 ± 1% exhibits minor deviations of Δz ≤ 1 mm, the same magnitude as the RMSE of the DEMs. The deviations range from ΔzORT,min = -2.9 ± 0.2 mm (defined as the 1% percentile of the deviations) to ΔzORT,max = 4.1 ± 0.1 mm (defined as the 99% percentile of the deviations). The peak of the distributions is positive, with a low peak value of 0.23 ± 0.20, indicating that most deviations are positive. The differences between MBTs and the respective digital target tile are less pronounced. The deviations range between ΔzMBT,min = -2.2 ± 0.2 mm to ΔzMBT,max = 2.1 ± 0.2 mm, while 73 ± 2% of the surface area exhibits Δz ≤ ± 1 mm. Hence, the oyster reef surrogate surface exhibits more significant deviations from the digital target surface than the mussel bed surrogate surface. Notably, the dip around the zero mean visible in all distributions is an artifact of the distance calculation without significant influence on the conclusions.
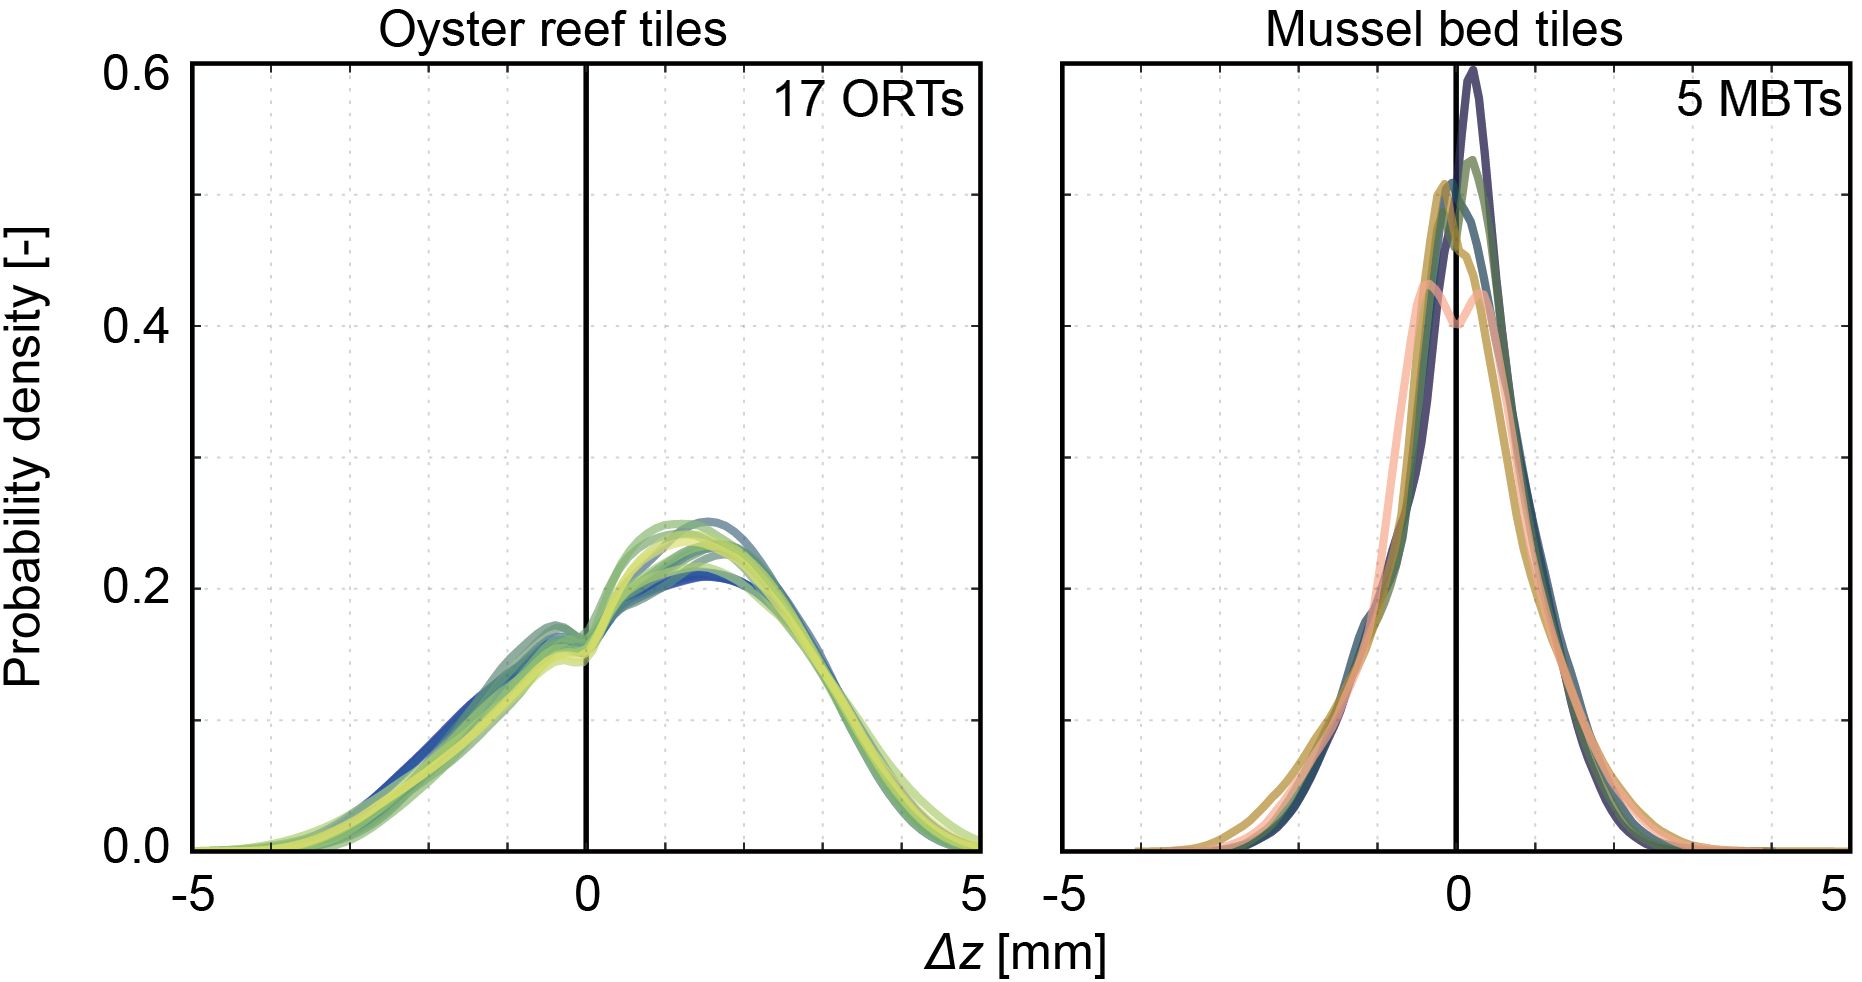
Figure 9 Histograms based on the deviations of the surface level elevations Δz [mm] between the manufactured surrogate model tiles and the respective digital target tile illustrating the probability density functions (PDFs) [-] of all samples sorted in oyster reef tiles (ORTs) and mussel bed tiles (MBTs). The PDFs are centered around the zero mean. The colors indicate the individual samples (Crameri, 2018).
To illustrate the spatial distribution of Δz, DEMs of differences (DoD) have been developed for each surrogate model tile (Figure 10). For the ORTs, the negative deviations are located at the shells’ ventral margins, and the positive deviations are located in the gaps between the shells. For the MBTs, negative and positive deviations Δz > ± 1 mm are scattered equally within the mussel agglomerations, illustrating some loss of detail within the structures. The large surface areas with minor deviations can be attributed to the planar sediment cover. Hence, the dimensional accuracy of the oyster reef surrogate surface inherited some limitations, while the mussel bed surrogate surface could be resolved with reasonable accuracy.
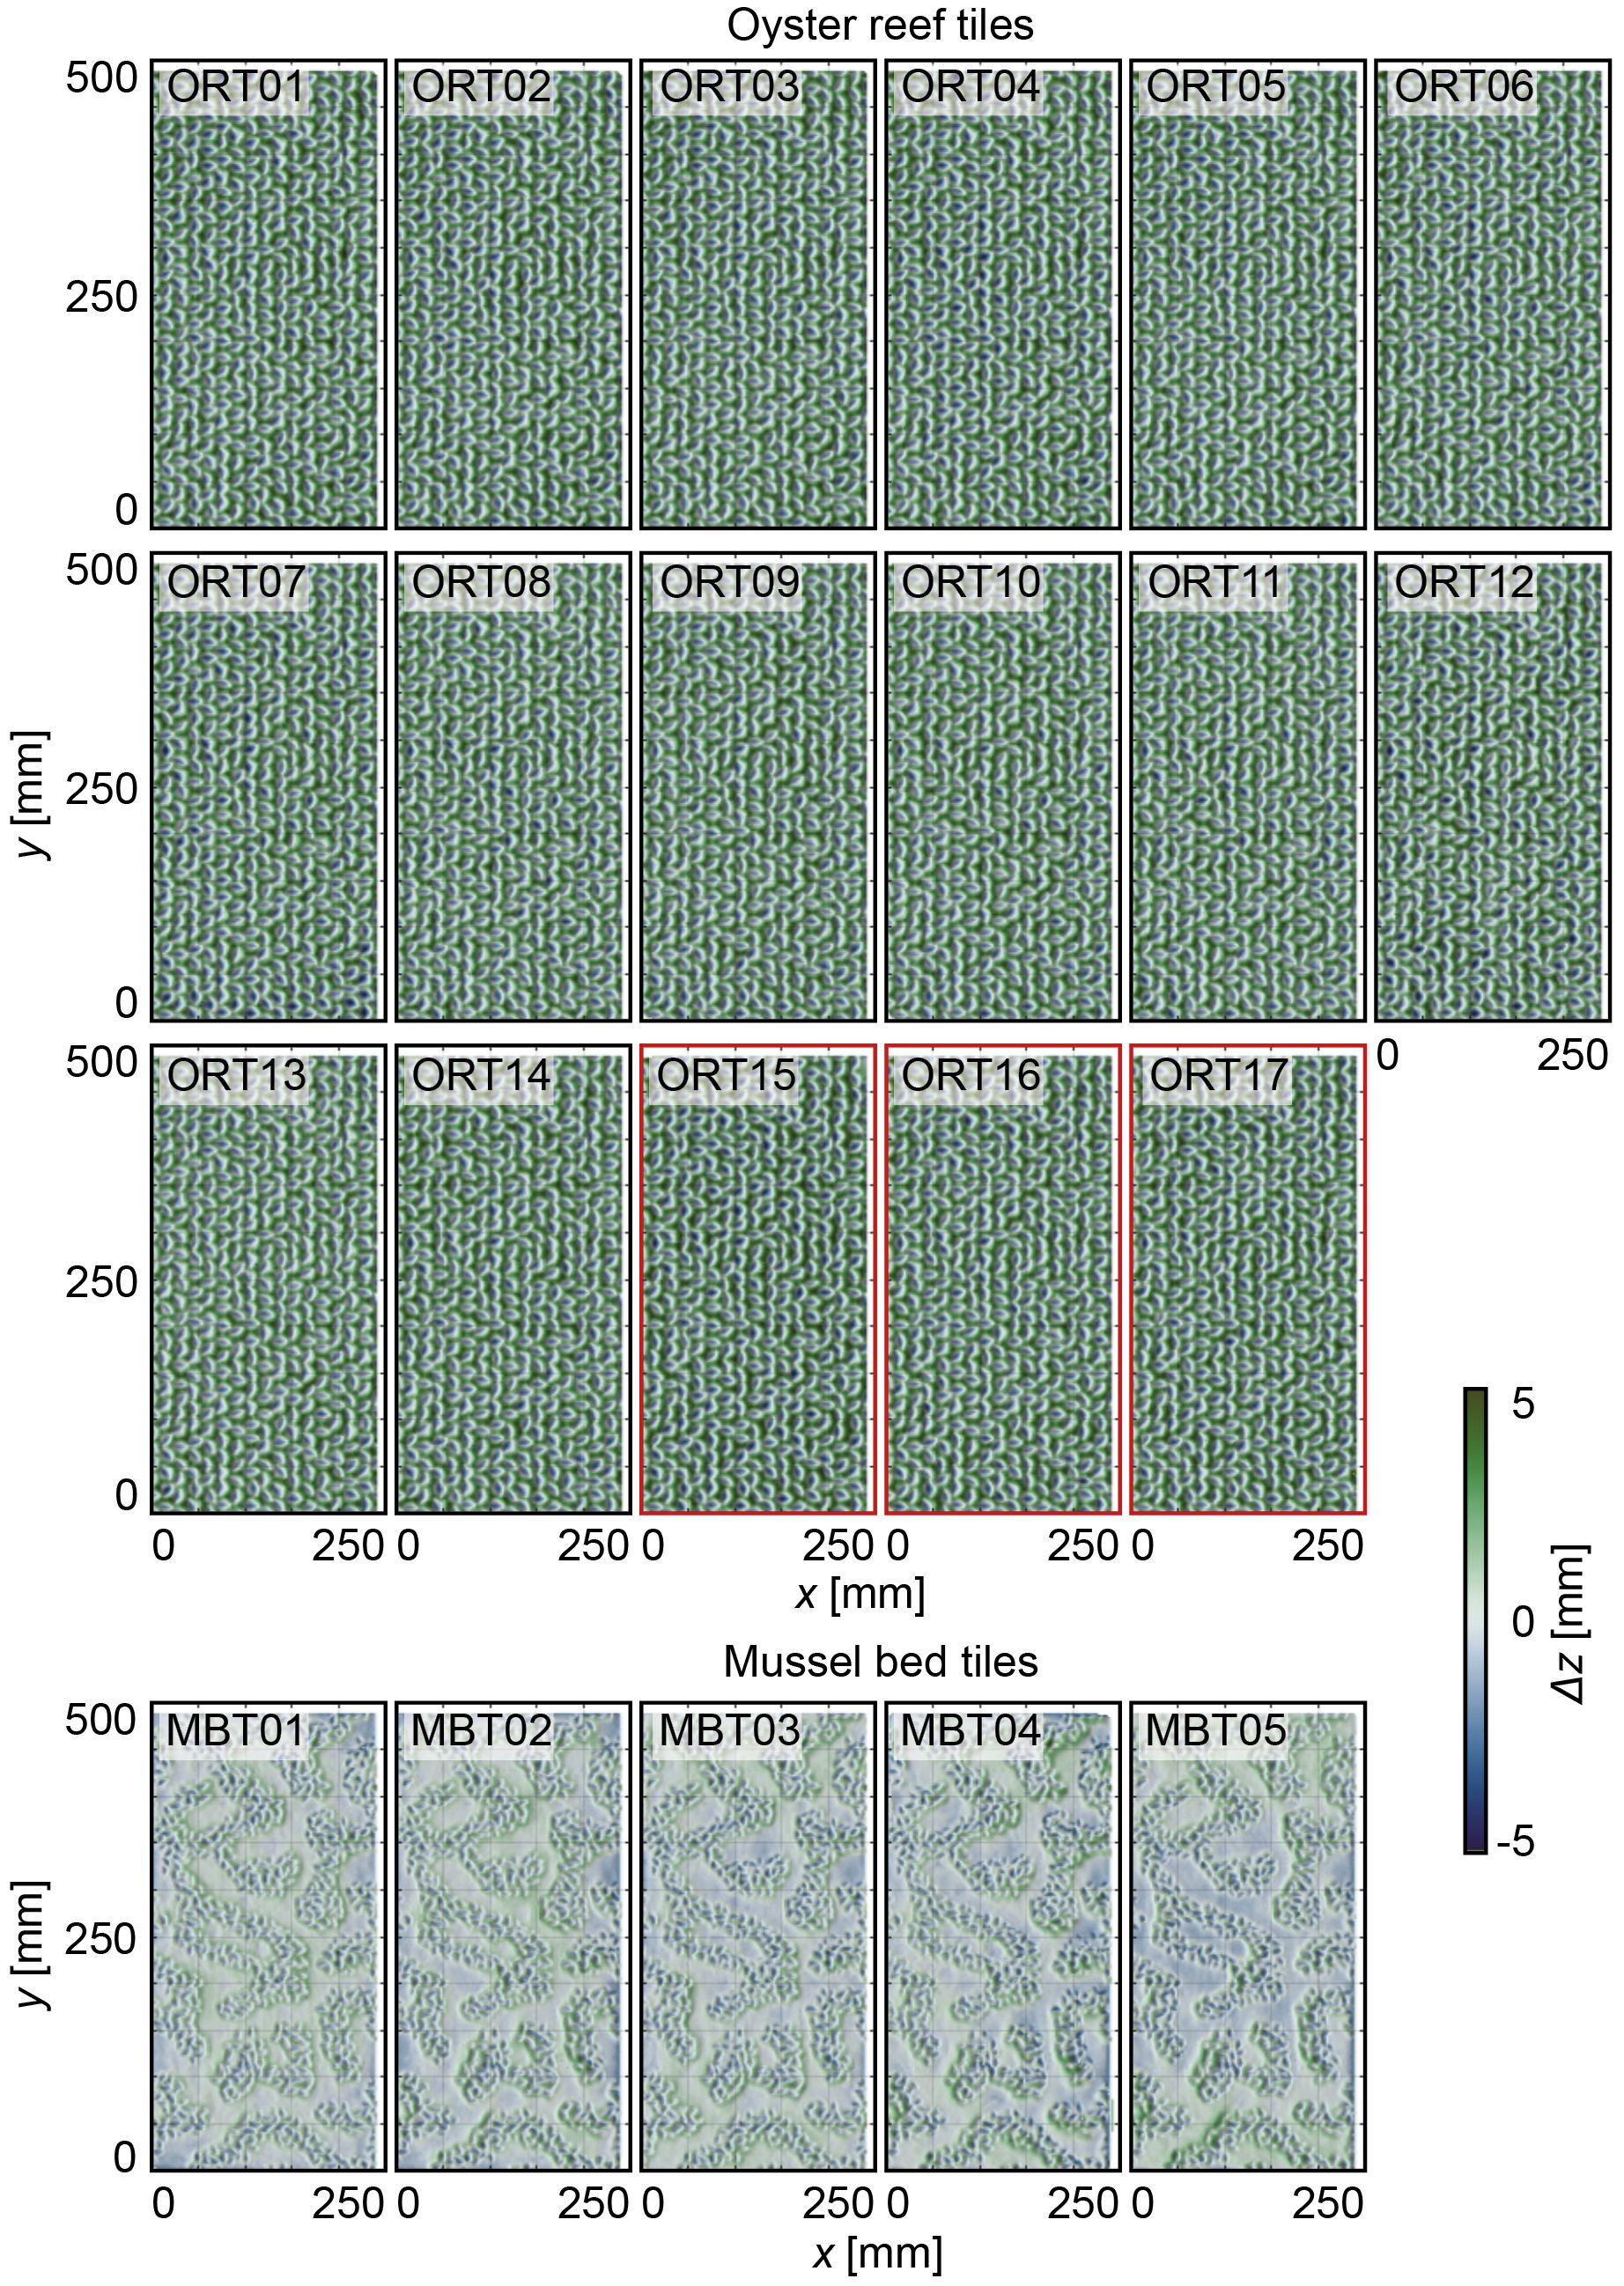
Figure 10 Visualizations of the digital elevation models of difference (DoDs) between the manufactured surrogate model tiles and the respective digital target tile of the 17 oyster reef tiles (ORTs) and five mussel bed tiles (MBTs), respectively. The x- and y-axis are in mm. The color scale (Crameri, 2018) indicates deviations of the surface level elevations Δz [mm] centered around the zero mean. ORT15 – ORT17 (red outlines) have been manually de-powdered.
3.5 Comparison to in situ oyster reef and mussel bed surfaces
Comparing the surface characteristics of the surrogate models to those of the in situ oyster reef and mussel bed obtained from the field studies reveals a distorted vertical scaling. The roughness heights kt and krms of both surrogate surfaces at the prototype scale (3:1) underestimate the values of the field study samples by approx. 50%. However, both kt and krms are in agreement at a vertical scale of 6:1 (Table 4). As shown in Section 3.2, the oyster reef surrogate surface could only be manufactured by the particle bed 3D printer with a vertical distortion, as steeper shells with ventral margins thinner than t ≤ 2 mm could not be accurately produced, or an excessive number of shell margins would break away during the cleaning process. To compare the hydraulic roughness between both surface types, it was decided to keep the vertical scaling between the ORT and the MBT consistent, although the MBT could have been manufactured without vertical distortion due to the less complex surface structure.
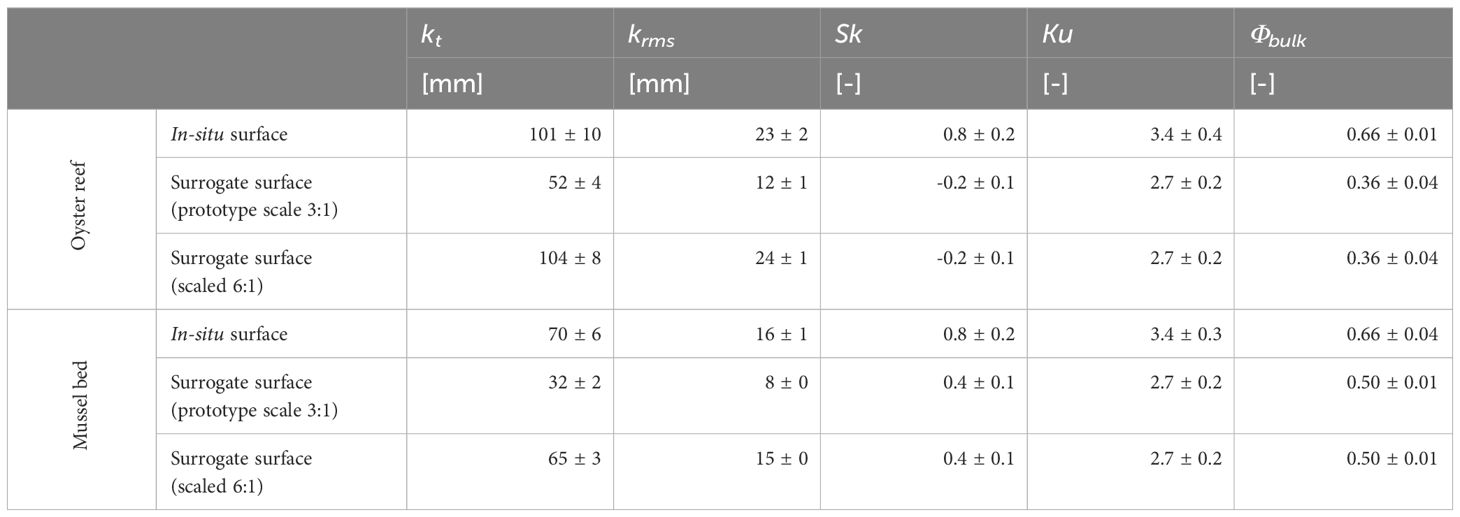
Table 4 Average topographical roughness parameters of the in-situ oyster reef and mussel bed samples and of the respective surrogate surface (at prototype scale 3:1 and at a scale of 6:1), where kt is the total roughness height, krms is the root-mean-square roughness height, Sk is the skewness, Ku is the kurtosis, Φbulk is the bulk porosity.
Consequently, the PDFs and their respective higher statistical moments exhibit differences between surrogate surfaces (Figure 8) and in-situ samples (Figure 4). While the PDFs of the oyster reef samples exhibit right-skewed distributions (SkOR = 0.8 ± 0.2), the PDFs of the surrogate model tiles are bell-shaped (SkORT = -0.2 ± 0.1). Furthermore, the average kurtosis of the surrogate surface is KuORT = 2.7 ± 0.2, revealing lighter tails of the PDFs compared to those of the oyster reef samples with KuOR = 3.4 ± 0.4. These deviations reflect the current limitation of particle bed 3D printing in resolving the thin ventral margins of the shell and the de-powdering of the gaps between shells, thus causing less pronounced tails of the distributions both in the positive and negative direction.
Comparing the PDFs of the mussel bed samples to those of the MBTs reveals more similar shapes. Both distributions are right-skewed, though with higher values for the in-situ samples (SkMB = 0.8 ± 0.2) compared to the MBTs (SkMBT = 0.4 ± 0.1). The kurtosis of the mussel bed exhibits similar deviations between the surrogate surface and in-situ samples (KuMBT = 2.7 ± 0.2 and KuMB = 3.4 ± 0.3) as those of the oyster reef. However, lower values for the higher statistical moments have been expected due to the vertical distortion.
4 Discussion
4.1 Fabrication of complex coastal surfaces with particle bed 3D printing with selective cement activation
The results illustrate that the investigated complex surfaces of coastal biogenic structures can be modeled using a limited number of defined topographical parameters, similar to the replications of M. edulis dropper lines by Landmann et al. (2019) and (2021a). High dimensional accuracy could be achieved for the mussel bed surrogate surface with moderate surface complexity. The deviations between the digital target and the manufactured surfaces are in the same order of magnitude as the RMSE of the DEMs. Nonetheless, the DoDs illustrate some loss in detail within the mussel agglomerations, which can be attributed to the horizontal printing resolution of the particle bed 3D printing with SCA. Similar loss in detail has been observed by Henry et al. (2018) and Aberle et al. (2021), who report on the replication of a rock-blasted tunnel using CNC milling. They report deviations of the manufactured surfaces from the digital target model of Δz ≤ ± 1.5 mm for 71% of the surface area. Due to the large spatial dimensions and as large-scale roughness features had been reproduced accurately, the authors deem the loss in detail acceptable with subordinate influence for the hydraulic testing. In comparison, the reported 73 ± 2% of surface area with Δz ≤ ± 1.0 mm indicates a higher dimensional accuracy for the mussel bed surrogate. Stewart et al. (2019) report standard deviations of the digital target model (σz,digital =1.5 mm) and manufactured rough gravel bed surfaces (σz,digital =1.58 – 1.71 mm). The deviations between digital target model and manufactured surface (Δσ = 0.08 – 0.21 mm) are comparable to the deviations of krms between digital target and manufactured MBTs Δkrms = 0.2 mm, indicating similar dimensional accuracy. For the oyster reef surface, characterized by highly complex features, the dimensional accuracy inherited some limitations. Despite optimizing the digital target model in an iterative process by, e.g., widening the shells’ ventral margins and adjusting the spatial arrangement, these deviations to real oyster reef surfaces remain. The limitations become apparent in the comparison between digital target and manufactured surrogate tiles (34 ± 1% of the surface area exhibits Δz ≤ ± 1 mm and Δkrms = 4.9 ± 0.3 mm; compare Section 3.3) and lead to deviations when comparing the surface characteristics to those of in-situ oyster reefs (compare Section 3.5). The deviations can be attributed, in particular, to the horizontal printing resolution, which limits the depiction of the thin shells and the de-powdering of the gaps between the shells. Secondly, the occasional breaking of individual shells in the post-processing further contributes to the deviations.
Highly accurate (< 1 mm) fabricated rough surfaces (Bertin et al., 2014; Flack et al., 2020) or objects (Landmann et al., 2019; Landmann et al., 2021b; Oertel and Shen, 2022) used in experimental modeling are typically limited to small dimensions of<1 m2 (or<1 m3). Stewart et al. (2019) and Dunbar et al. (2023) present an alternative approach to manufacturing large-scale surrogate surfaces of rough gravel beds. Their methodology involves creating a single master tile, casting silicone molds from the master tile, and manufacturing replicas from epoxy resin. Stewart et al. (2019) used a CNC-milled master tile to manufacture surface areas of 22.6 m2, and Dunbar et al. (2023) used a 3D-printed master tile to produce 2.6 m2 with high degrees of accuracy. It is assumed that this approach would be suitable to fabricate and manufacture the mussel bed surrogate model but would face challenges in the replication of the oyster reef surrogate surface, as stripping the replicas from the molds would be difficult due to the small gaps and thin ventral margins of the shells.
The materials necessary for the particle bed 3D printing with SCA (sand, cement, and methylcellulose) are relatively inexpensive compared to traditional polymer-based 3D printing materials. Furthermore, in contrast to other 3D printing techniques, the production time of the particle bed 3D printing process does not increase with the increasing complexity of the surrogate surface due to the selective cement activation in each layer of the particle bed during the fabrication process (Lowke et al., 2018). These factors allowed for the cost- and time-effective fabrication of large-scale surrogate surfaces.
Thus, the particle bed 3D printing technique, in combination with the material used here, can accurately produce moderately complex surfaces but faces inherent limitations with highly complex features, especially in reproducing sharp edges and thin gaps in randomized arrangements. To enhance the accuracy, particularly in fabricating sharp edges, e.g., the oyster shells’ ventral margins, using the SCA process, further investigation into the material-process interaction during the printing process is needed. Understanding the effects of, e.g., particle diameter, liquid application, and added binders or additives is crucial for achieving higher fidelity in the fabrication of complex and ultra-rough surface structures (Lowke et al., 2022; Mai et al., 2022a, Mai et al., 2022b; Herding et al., 2023). Addressing factors such as cleaning methods and potential variations in oyster and mussel shells will contribute to a more comprehensive understanding of the replication process. Though not explored within the scope of this study, particle bed 3D printing with SCA enables the fabrication of porous and permeable surfaces or large overhangs, which may contribute to cavities. This capability enables research opportunities for fabricating and manufacturing surrogate models that exhibit such features, e.g., coral reefs or mangrove forests, with large spatial dimensions.
4.2 Rigid models for hydraulic experimental modeling
Rigid surrogate models, as presented in this work, allow for the investigation of the influence of rough surfaces on the ambient hydrodynamics. Due to the complex surface topographies featuring sharp edges (to a certain degree) and thin cavities at large spatial dimensions, hydraulic testing to investigate the bottom boundary layer and the intricate interactions between flow around the individual oyster shells (in-canopy flow) and the flow above the reef are possible. Microscale patterns, as outlined in the structural classification of oyster reef surfaces by Hitzegrad et al. (2022), can easily be replicated by altering the spatial arrangement of the individual tiles. Hence, the classes Central Reef, Transitional Zone, Patches, and Garland can be replicated by decreasing the tile density in the experimental facility. In combination with state-of-the-art time-resolved measurement of the flow fields using, e.g., particle image velocimetry or particle tracking velocimetry, the surrogate surfaces offer the potential to significantly increase the understanding of the vertical exchange of volume and momentum to and from the gaps between shells and the turbulence structures over such surfaces. Thorough examinations of the vertical mixing and the turbulence statistics may have important implications for, e.g., energy dissipation, nutrient and oxygen exchange in the water column, larval settlement, erosion, and sediment settlement. Furthermore, by selecting the native mussel bed and the non-native oyster reef as target coastal biogenic structures, this work enables comparable experimental studies assessing the impact of invasive species on the surrounding hydrodynamics in light of climate change and sea-level rise. Building upon the basic experimental study by Borsje et al. (2011), these investigations aim to optimize the applications of oyster reefs and mussel beds as nature-based solutions in coastal protection. This may involve integrating wave damping and sediment stabilization effects of naturally occurring biogenic structures into coastal management plans or guiding restoration and establishment efforts by providing hard substrate to enhance initial settlement, thereby promoting sediment accretion in tidal flats to counteract an accelerating sea level rise.
However, the rigidity of these surrogate models impedes the response of real biogenic structures to the exposure of ambient hydrodynamics, which has varying implications depending on how strongly the hydrodynamics impact the surface. Mussel beds feature individuals interconnected by flexible byssus threads, enabling movement with the ambient waves and currents, reducing stress on the individuals. Furthermore, byssus threads are known to fail when excessive stresses are applied, which can destroy entire mussel beds (Widdows et al., 2002, 2009; Donker et al., 2015). Hence, the mussel bed surrogate model may overestimate the impact of real mussel bed surfaces on the ambient waves and currents during intense hydrodynamic conditions. Additionally, the surrogate model is unsuitable for investigating, e.g., the threshold of motion of the shells, as investigated by Fick et al. (2020). Conversely, oyster individuals are connected by cementeous bonds, forming rigid structures, which cause higher resistance to mechanical stresses (Smaal et al., 2005; Taylor and Bushek, 2008; Bungenstock et al., 2021). Hence, it is assumed that the oyster reef surrogate surface will reflect the behavior of real oyster reefs even under intense hydrodynamic conditions. The challenges in replicating the razor-sharp margins of the oyster shells may result in underestimating the wave attenuation of experimental studies, especially as sharp edges act as nucleation for frictional energy dissipation (Hitzegrad et al., 2024). Moreover, the vertical distortion of the surrogate models compared to the in-situ biogenic structures (see Section 3.5), which arise as manufacturing artifacts, affect the geometric, kinematic, and dynamic similitude (Yalin, 1971; Hughes, 1993). Thus, validating the results of the hydrodynamic experiments against those of field surveys (e.g., Widdows et al., 2009; Donker et al., 2013) or experimental studies with real mussels or oysters (e.g., Butman et al., 1994; Folkard and Gascoigne, 2009) with comparable hydrodynamic conditions are essential to estimate resulting deviations and may enable implementing appropriate correction techniques.
Additionally, mussels and oysters exert siphonal currents during filter-feeding, adding to the turbulence in boundary layers (Monismith et al., 1990; van Duren et al., 2006; Kumar et al., 2019). For freshwater mussels, Sansom et al. (2018) report excurrent velocities of 0.004 – 0.2 m/s, reaching similar magnitudes as the tidal flow velocity in the intertidal flats of 0.1 – 0.5 m/s (Hagen et al., 2020). During filter-feeding, mussels and oysters open their valves at low to intermediate flow velocities (van Duren et al., 2006), increasing the topographic roughness. Furthermore, while the manufactured surrogate model tiles are impermeable, real oyster reefs and mussel beds are settled on permeable, porous sediments. These sediments allow exchange processes between the mainstream and the groundwater flow within the sediment. The constraints outlined above illustrate that rigid surrogate models neglect certain aspects of coastal biogenic structures, which need to be considered when analyzing the results of the experimental studies. Addressing and mitigating these constraints should be key areas for future research endeavors.
4.3 Opportunities of the applied methodology
The presented work suggests a flexible and iterative design methodology employing advanced digital design strategies. The results illustrate the effective application of developing parameterized surrogate models for experimental modeling. Hereby, quality control has been conducted in two loops: 1) by optimizing the parametrization through iterative modeling and fabrication of prototype tiles based on a qualitative assessment, and 2) by validation of the entire surrogate surfaces by comparison to in-situ topographical roughness parameters after completing the manufacturing. In future studies, the presented workflow can easily be adapted to include different methods of digital manufacturing, e.g., polymer-based 3D printing or fabrication of a highly accurate master tile and producing replicas with silicone molds, similar to Stewart et al. (2019) and Dunbar et al. (2023), or non-waste wax molds, as presented by Mainka et al. (2016). Furthermore, the topographical parameters defining the design and the validation are interchangeable and expandable. For example, the vertical porosity distribution (Navaratnam and Aberle, 2017), fractal dimensions, wavenumber spectra (Stewart et al., 2019), or second-order structure functions (Nikora et al., 1998) are possible parameters to include in the validation.
The workflow shares similarities with those proposed in topography-based eco-engineering for enhancing biodiversity in artificial coastal structures or degrading ecosystems. Several studies (Evans et al., 2021; Levy et al., 2022; Perricone et al., 2023) outline multi-step workflows involving the identification of relevant parameters, biometric design of habitat units (or direct replication of the ‘best’ natural surface), manufacturing of habitat units, and evaluation of success. In contrast to this study, different input parameters are considered as, in addition to topographical input parameters, site-specific biological and ecological parameters are relevant, and instead of requirements of the experimental setup, the properties of the artificial structure or bed surface on which the habitat units will be installed are essential. The variance of target parameters used for quality control or assessment schemes would require further research with clear-cut and context-specific objectives to understand what minimal parameter ranges suffice in real-world applications. More importantly, the success of the eco-engineering design is defined by increasing biodiversity and not by achieving accuracy thresholds in the manufacturing.
Moreover, particle bed 3D printing with SCA may offer a new manufacturing method in the field of eco-engineering to enhance biodiversity in coastal artificial structures. Due to its ability to fabricate porous objects with roughness features on different scales, including large overhangs and small cavities, it allows mimicking intricate natural features of biogenic structures that can not be realized for large-scale applications by applying previously used additive manufacturing methods (Levy et al., 2022) or casting from molds and formliners (Sella and Perkol-Finkel, 2015; Perkol-Finkel et al., 2018; Evans et al., 2021; Kosová et al., 2023). Furthermore, manufactured objects could even be individualized without increasing production time. However, further research would be required to develop appropriate surface structures, refine material selection suitable for coastal contexts, and affirm its effectiveness in enhancing biodiversity for coastal environments.
5 Conclusion
The primary aim of this work was to investigate the feasibility of replicating surfaces of complex coastal biogenic structures for experimental modeling using advanced digital design and manufacturing strategies. Generic surrogate surfaces representing two target biogenic structures in the central Wadden Sea, oyster reefs and mussel beds, have been designed, manufactured, and validated. The key findings of this work can be summarized as follows:
• The design methodology allows for the manufacturing of generic surrogate surfaces of complex coastal biogenic structures with high accuracy while employing a limited number of defined parameters in the modeling.
• Challenges remain in achieving complete comparability between the manufactured surrogate models and in-situ biogenic structures, depending on the surface complexity.
• Particle bed 3D printing with Selective Cement Activation proved to be a suitable method to produce complex and ultra-rough surrogate models for experimental modeling at large spatial dimensions, especially considering its capability to produce highly three-dimensional geometries, including porosity and large overhangs, and the independence of production time from the model complexity. Future research should focus on refining the fabrication process, considering the unique characteristics of coastal biogenic structures.
• The manufactured generic surrogate surfaces enable detailed investigations into the influence of complex coastal biogenic structures on the ambient hydrodynamics, thereby enhancing the understanding of the processes governing wave attenuation, turbulence production, and vertical mixing needed for efficient application of natural biogenic structures, e.g., oyster reefs and mussel beds, as a nature-based solution on coastal protection or restoration and establishment efforts.
Data availability statement
The raw data supporting the conclusions of this article will be made available by the authors, without undue reservation.
Ethics statement
The manuscript presents research on animals that do not require ethical approval for their study.
Author contributions
JH: Conceptualization, Data curation, Formal analysis, Investigation, Methodology, Software, Visualization, Writing – original draft, Validation. LB: Conceptualization, Data curation, Formal analysis, Investigation, Methodology, Software, Validation, Visualization, Writing – original draft. FH: Investigation, Methodology, Writing – original draft, Validation. KP: Investigation, Writing – review & editing. SJ: Investigation, Writing – review & editing. ES: Data curation, Formal analysis, Investigation, Writing – review & editing. JM: Conceptualization, Writing – review & editing. IM: Methodology, Writing – original draft, . CW: Project administration, Supervision, Writing – review & editing. HK: Funding acquisition, Project administration, Resources, Writing – review & editing. AW: Funding acquisition, Project administration, Resources, Writing – review & editing. DL: Funding acquisition, Methodology, Resources, Writing – review & editing. NG: Funding acquisition, Methodology, Project administration, Resources, Supervision, Writing – review & editing, Conceptualization.
Funding
The author(s) declare financial support was received for the research, authorship, and/or publication of this article. The project “BIVA-WATT” on which this report is based was funded by the Ministry of Education and Research of Germany (BMBF) under the funding code 03KIS127. The development of the used material and the decision for the process parameters in the 3D-printer are funded by the Deutsche Forschungsgemeinschaft (DFG, German Research Foundation) – TRR 277/1 2020 – Project number 414265976. The authors thank the DFG for the support within the CRC/Transregio 277 - Additive Manufacturing in Construction (Project A01). The 3D-printer is funded by the European funding for the regions in Lower Saxony (EFRE)/NBank within the project “Rheo Struc 3D Lab” (85023242). The authors acknowledge support from the Open Access Publication Funds of Technische Universität Braunschweig.
Acknowledgments
We would like to thank the captain and the crew of the FK Senckenberg for providing the logistics needed during the field studies. Further, we want to thank Torsten Janßen (Senckenberg am Meer) for his organizational work in the background and assistance during the fieldwork. The Lower Saxon Wadden Sea National Park Authority (Wilhelmshaven) is thanked for permits and cooperation. Moreover, we would like to thank all student assistants for helping in the manufacturing process. The tool chatGPT (v. 3.5) was utilized to improve individual formulation, grammar, and spelling but not to create original content.
Conflict of interest
The authors declare that the research was conducted in the absence of any commercial or financial relationships that could be construed as a potential conflict of interest.
Publisher’s note
All claims expressed in this article are solely those of the authors and do not necessarily represent those of their affiliated organizations, or those of the publisher, the editors and the reviewers. Any product that may be evaluated in this article, or claim that may be made by its manufacturer, is not guaranteed or endorsed by the publisher.
References
Aberle J., Eikenberg R., Branß T., Henry P.-Y. (2021). Technical Note: On the Production and Accuracy of CNC-Manufactured Hydraulic Scale Models. Water 13, 916. doi: 10.3390/w13070916
Aberle J., Nikora V. I. (2006). Statistical properties of armored gravel bed surfaces. Water Resour. Res. 42, W11414. doi: 10.1029/2005WR004674
Aish R., Woodbury R. (2005). ““Multi-level Interaction in Parametric Design,” in Smart Graphics. Eds. Hutchison D., Kanade T., Kittler J., Kleinberg J. M., Mattern F., Mitchell J. C., et al (Springer Berlin Heidelberg, Berlin, Heidelberg), 151–162.
Arakawa K. Y. (1990). Natural spat collecting in the Pacific oyster Crassostrea gigas (Thunberg). Mar. Behav. Physiol. 17, 95–128. doi: 10.1080/10236249009378760
Arnaud G., Rey V., Touboul J., Sous D., Molin B., Gouaud F. (2017). Wave propagation through dense vertical cylinder arrays: Interference process and specific surface effects on damping. Appl. Ocean Res. 65, 229–237. doi: 10.1016/j.apor.2017.04.011
Baxter T. I., Coombes M. A., Viles H. A. (2022). The bioprotective properties of the blue mussel (Mytilus edulis) on intertidal rocky shore platforms. Mar. Geology 445, 106734. doi: 10.1016/j.margeo.2022.106734
Bergström P., Lindegarth M. (2016). Environmental influence on mussel (Mytilus edulis ) growth – A quantile regression approach. Estuarine Coast. Shelf Sci. 171, 123–132. doi: 10.1016/j.ecss.2016.01.040
Bertin S., Friedrich H., Delmas P., Chan E., Gimel'farb G. (2014). Dem quality assessment with a 3d printed gravel bed applied to stereo photogrammetry. Photogram Rec 29, 241–264. doi: 10.1111/phor.12061
Borsje B. W., van Wesenbeeck B. K., Dekker F., Paalvast P., Bouma T. J., van Katwijk M. M., et al. (2011). How ecological engineering can serve in coastal protection. Ecol. Eng. 37, 113–122. doi: 10.1016/j.ecoleng.2010.11.027
Bouma T. J., van Belzen J., Balke T., Zhu Z., Airoldi L., Blight A. J., et al. (2014). Identifying knowledge gaps hampering application of intertidal habitats in coastal protection: Opportunities & steps to take. Coast. Eng. 87, 147–157. doi: 10.1016/j.coastaleng.2013.11.014
Brandt G., Wehrmann A., Wirtz K. W. (2008). Rapid invasion of Crassostrea gigas into the German Wadden Sea dominated by larval supply. J. Sea Res. 59, 279–296. doi: 10.1016/j.seares.2008.03.004
Brenner M., Buck B. H. (2010). Attachment properties of blue mussel (Mytilus edulis L.) byssus threads on culture-based artificial collector substrates. Aquacultural Eng. 42, 128–139. doi: 10.1016/j.aquaeng.2010.02.001
Briggs M. J. (2013). Basics of Physical Modeling in Coastal and Hydraulic Engineering. ASCE Tech. note (Coastal Hydraulics Engineering) No. ERDC/CHL CHETN; XIII-3. USA: US Army Engineer Research and Development Center.
Bungenstock F., Hertweck G., Hochstein M. L., Wehrmann A. (2021). Distribution pattern and controls of biosedimentary facies in backbarrier tidal flats of the central Wadden Sea (North Sea). J. Appl. Regional Geology 172, 409–428. doi: 10.1127/zdgg/2021/0248
Burkett J. R., Hight L. M., Kenny P., Wilker J. J. (2010). Oysters Produce an Organic-Inorganic Adhesive for Intertidal Reef Construction. J. Am. Chem. Soc 132, 12531–12533. doi: 10.1021/ja104996y
Buschbaum C., Saier B. (2001). Growth of the mussel Mytilus edulis L. in the Wadden Sea affected by tidal emergence and barnacle epibionts. J. Sea Res. 45, 27–36. doi: 10.1016/S1385-1101(00)00061-7
Buswell R. A., Da Silva W. L., Bos F. P., Schipper H. R., Lowke D., Hack N., et al. (2020). A process classification framework for defining and describing Digital Fabrication with Concrete. Cement Concrete Res. 134, 106068. doi: 10.1016/j.cemconres.2020.106068
Butman C. A., Fréchette M., Geyer W. R., Starczak V. R. (1994). Flume experiments on food supply to the blue mussel Mytilus edulis L. as a function of boundary-layerflow. Limnol. Oceanogr. 39, 1755–1768. doi: 10.4319/LO.1994.39.7.1755
Chowdhury M. S. N., Walles B., Sharifuzzaman S. M., Shahadat Hossain M., Ysebaert T., Smaal A. C. (2019). Oyster breakwater reefs promote adjacent mudflat stability and salt marsh growth in a monsoon dominated subtropical coast. Sci. Rep. 9, 1–12. doi: 10.1038/s41598-019-44925-6
Chung D., Hutchins N., Schultz M. P., Flack K. A. (2021). Predicting the drag of rough surfaces. Annu. Rev. Fluid Mech. 53, 439–471. doi: 10.1146/annurev-fluid-062520-115127
Crameri F. (2018). Geodynamic diagnostics, scientific visualisation and StagLab 3.0. Geosci. Model. Dev. 11, 2541–2562. doi: 10.5194/gmd-11-2541-2018
Dankers N., Brinkman A., Meijboom A., Dijkman E. M. (2001). Recovery of intertidal mussel beds in the Wadden Sea: use of habitat maps in the management of the fishery. Hydrobiologia 465, 21–30. doi: 10.1023/A:1014592808410
Diederich S. (2005). Invasion of Pacific oysters (Crassostrea gigas) in the Wadden Sea: competitive advantage over native mussels (Kiel: University Kiel).
Dixen M., Hatipoglu F., Sumer B. M., Fredsøe J. (2008). Wave boundary layer over a stone-covered bed. Coast. Eng. 55, 1–20. doi: 10.1016/j.coastaleng.2007.06.005
Donker J., van der Vegt M., Hoekstra P. (2013). Wave forcing over an intertidal mussel bed. J. Sea Res. 82, 54–66. doi: 10.1016/j.seares.2012.08.010
Donker J., van der Vegt M., Hoekstra P. (2015). Erosion of an intertidal mussel bed by ice- and wave-action. Continental Shelf Res. 106, 60–69. doi: 10.1016/j.csr.2015.07.007
Dunbar D., van der A D. A., Scandura P., O'Donoghue T. (2023). An experimental and numerical study of turbulent oscillatory flow over an irregular rough wall. J. Fluid Mech. 955, A33. doi: 10.1017/jfm.2022.1090
Dunlop T., Glamore W., Felder S. (2023). Restoring estuarine ecosystems using nature-based solutions: Towards an integrated eco-engineering design guideline. Sci. Total Environ. 873, 162362. doi: 10.1016/j.scitotenv.2023.162362
Ehrnsten E., Sun X., Humborg C., Norkko A., Savchuk O. P., Slomp C. P., et al. (2020). Understanding Environmental Changes in Temperate Coastal Seas: Linking Models of Benthic Fauna to Carbon and Nutrient Fluxes. Front. Mar. Sci. 7. doi: 10.3389/fmars.2020.00450
Evans A. J., Lawrence P. J., Natanzi A. S., Moore P. J., Davies A. J., Crowe T. P., et al. (2021). Replicating natural topography on marine artificial structures – A novel approach to eco-engineering. Ecol. Eng. 160, 106144. doi: 10.1016/j.ecoleng.2020.106144
Faulhaber P. (2007). Neue Methoden der aerodynamischen Modellierung flussbaulicher Fragestellungen. Mitteilungsblatt der Bundesanstalt für Wasserbau 90, 47–74.
Fick C., Puhl E., Toldo E. E. (2020). Threshold of motion of bivalve and gastropod shells under oscillatory flow in flume experiments. Sedimentology 67, 627–648. doi: 10.1111/sed.12657
Flack K. A., Schultz M. P., Barros J. M. (2020). Skin Friction Measurements of Systematically-Varied Roughness: Probing the Role of Roughness Amplitude and Skewness. Flow Turbulence Combust 104, 317–329. doi: 10.1007/s10494-019-00077-1
Folkard A. M., Gascoigne J. C. (2009). Hydrodynamics of discontinuous mussel beds: Laboratory flume simulations. J. Sea Res. 62, 250–257. doi: 10.1016/j.seares.2009.06.001
Folmer E. O., Büttger H., Herlyn M., Markert A., Millat G., Troost K., et al. (2017). “Beds of blue mussels and Pacific oysters,” in Wadden Sea Quality Status Report 2017. Ed. Kloepper S., et al (Common Wadden Sea Secretary, Wilhelmshaven, Germany).
Folmer E. O., Drent J., Troost K., Büttger H., Dankers N., Jansen J., et al. (2014). Large-Scale Spatial Dynamics of Intertidal Mussel (Mytilus edulis L.) Bed Coverage in the German and Dutch Wadden Sea. Ecosystems 17, 550–566. doi: 10.1007/s10021-013-9742-4
Fredsøe J., Andersen K. H., Mutlu Sumer B. (1999). Wave plus current over a ripple-covered bed. Coast. Eng. 38, 177–221. doi: 10.1016/S0378-3839(99)00047-2
Garvis S. K. (2012). Quantifying the impacts of oyster reef restoration on oyster coverage, wave energy dissipation and seagrass recruitment in Mosquito Lagoon, Florida. University of Central Florida, Department of Biology, Orlando, FL.
Gibson I., Rosen D., Stucker B., Khorasani M. (2021). Additive Manufacturing Technologies (Cham, Germany: Springer International Publishing).
Gmelin J. F. (1791). ““Vermes,” in Caroli a Linnaei Systema Naturae per Regna Tria Naturae. Ed. Gmelin J. F.(Leipzig, Germany: G. E. Beer), 3021–3910.
Gracia A., Rangel-Buitrago N., O. J. A., Williams A. T. (2018). Use of ecosystems in coastal erosion management. Ocean Coast. Manage. 156, 277–289. doi: 10.1016/j.ocecoaman.2017.07.009
Grady J. E., Haller W. J., Poinsatte P. E., Halbig M. C., Schnulo S. L., Singh M., et al. (2015). A Fully Nonmetallic Gas Turbine Engine Enabled by Additive Manufacturing - Part I: System Analysis, Component Identifi cation, Additive Manufacturing, and Testing of Polymer Composites (USA: Princeton).
Groover M. P. (2020). Fundamentals of modern manufacturing: Materials, processes, and systems (Hoboken, NJ: John Wiley & Sons, Inc).
Gutiérrez J. L., Jones C. G., Strayer D. L., Iribarne O. O. (2003). Mollusks as ecosystem engineers: The role of shell production in aquatic habitats. Oikos 101, 79–90. doi: 10.1034/j.1600-0706.2003.12322.x
Hagen R., Plüß A., Freund J., Ihde R., Kösters F., Schrage N., et al. (2020). Data from: EasyGSH-DB: Themengebiet - Hydrodynamik (Bundesanstalt für Wasserbau). doi: 10.48437/02.2020.K2.7000.0003
Harris D. L., Rovere A., Casella E., Power H., Canavesio R., Collin A., et al. (2018). Coral reef structural complexity provides important coastal protection from waves under rising sea levels. Sci. Adv. 4, eaao4350. doi: 10.1126/sciadv.aao4350
Hartcher-O’Brien J., Evers J., Tempelman E. (2019). Surface roughness of 3D printed materials: Comparing physical measurements and human perception. Materials Today Commun. 19, 300–305. doi: 10.1016/j.mtcomm.2019.01.008
Hayward P. J., Ryland J. S. (2017). Handbook of the marine fauna of North-West Europe (Oxford, New York: NY: Oxford University Press).
Henry P.-Y., Aberle J., Navaratnam C. U., Ruther N. (2018). Hydraulic physical model production with Computer Numerically Controlled (CNC) manufacturing techniques. E3S Web Conf. 40, 5065. doi: 10.1051/e3sconf/20184005065
Herding F., Mai I., Lowke D. (2022). “Effect of Curing in Selective Cement Activation,” in Third RILEM International Conference on Concrete and Digital Fabrication. Eds. Buswell R., Blanco A., Cavalaro S., Kinnell P. (Springer International Publishing, Cham), 283–288.
Herding F., Mai I., Lowke D. (2023). Reduction of the cement content in Selective Cement Activation. ce papers 6, 790–796. doi: 10.1002/cepa.2826
Hitzegrad J., Brohmann L., Pfennings K., Hoffmann T. K., Eilrich A. K., Paul M., et al. (2022). Oyster reef surfaces in the central Wadden Sea: Intra-reef classification and comprehensive statistical description. Front. Mar. Sci. 9. doi: 10.3389/fmars.2022.808018
Hitzegrad J., Köster S., Windt C., Goseberg N. (2024). Understanding the Role of Sharp Edges in the Propagation of Surface Gravity Waves. J. Geophys. Res. 129, e2023JC020336. doi: 10.1029/2023JC020336
Hodge R. A., Hoey T. B. (2016a). A Froude-scaled model of a bedrock-alluvial channel reach: 1. Hydraulics. J. Geophys. Res. Earth Surf. 121, 1578–1596. doi: 10.1002/2015JF003706
Hodge R. A., Hoey T. B. (2016b). A Froude-scaled model of a bedrock-alluvial channel reach: 2. Sediment cover. J. Geophys. Res. Earth Surf. 121, 1597–1618. doi: 10.1002/2015JF003709
Hoffmann T. K., Pfennings K., Hitzegrad J., Brohmann L., Welzel M., Paul M., et al. (2023). Low-cost UAV monitoring: insights into seasonal volumetric changes of an oyster reef in the German Wadden Sea. Front. Mar. Sci. 10. doi: 10.3389/fmars.2023.1245926
Hughes R. N., Hughes D. J., Smith I. P., Dale A. C., Barnes H. (2016). Oceanography and marine biology: An annual review (Boca Raton, Florida: CRC Press).
Hughes S. A. (1993). Physical Models and Laboratory Techniques in Coastal Engineering (World Scientific).
Hunt H. L., Scheibling R. E. (2001). Predicting wave dislodgment of mussels: variation in attachment strength with body size, habitat, and season. Mar. Ecol. Prog. Ser. 213, 157–164. doi: 10.3354/meps213157
James M. R., Robson S., d'Oleire-Oltmanns S., Niethammer U. (2017). Optimising UAV topographic surveys processed with structure-from-motion: Ground control quality, quantity and bundle adjustment. Geomorphology 280, 51–66. doi: 10.1016/j.geomorph.2016.11.021
Jones C. G., Lawton J. H., Shachak M. (1994). Organisms as ecosystem engineers. Oikos 69, 373–386. doi: 10.2307/3545850
Khajavi S. H., Partanen J., Holmström J. (2014). Additive manufacturing in the spare parts supply chain. Comput. Industry 65, 50–63. doi: 10.1016/j.compind.2013.07.008
Kim G. B., Lee S., Kim H., Yang D. H., Kim Y.-H., Kyung Y. S., et al. (2016). Three-Dimensional Printing: Basic Principles and Applications in Medicine and Radiology. Korean J. Radiol. 17, 182–197. doi: 10.3348/kjr.2016.17.2.182
Kitsikoudis V., Kibler K. M., Walters L. J. (2020). In-situ measurements of turbulent flow over intertidal natural and degraded oyster reefs in an estuarine lagoon. Ecol. Eng. 143, 105688. doi: 10.1016/j.ecoleng.2019.105688
Kloft H., Hack N., Mainka J., Brohmann L., Herrmann E., Ledderose L., et al. (2019). Additive Fertigung im Bauwesen: erste 3-D-gedruckte und bewehrte Betonbauteile im Shotcrete-3-D-Printing-Verfahren (SC3DP). Bautechnik 96, 929–938. doi: 10.1002/bate.201900094
Kosová E., James K., MacArthur M., Vovides A., Peters J., Metcalfe D., et al. (2023). The BioGeo Ecotile: Improving biodiversity on coastal defences using a multiscale, multispecies eco-engineering design. Ecol. Eng. 188, 106881. doi: 10.1016/j.ecoleng.2022.106881
Kumar S. S., Kozarek J., Hornbach D., Hondzo M., Hong J. (2019). Experimental investigation of turbulent flow over live mussels. Environ. Fluid Mech. 19, 1417–1430. doi: 10.1007/s10652-019-09664-2
Landmann J., Fröhling L., Gieschen R., Buck B. H., Heasman K., Scott N., et al. (2021a). Drag and inertia coefficients of live and surrogate shellfish dropper lines under steady and oscillatory flow. Ocean Eng. 235, 109377. doi: 10.1016/j.oceaneng.2021.109377
Landmann J., Fröhling L., Gieschen R., Buck B. H., Heasman K., Scott N., et al. (2021b). New system design for the cultivation of extractive species at exposed sites - Part 2: Experimental modelling in waves and currents. Appl. Ocean Res. 113, 102749. doi: 10.1016/j.apor.2021.102749
Landmann J., Ongsiek T., Goseberg N., Heasman K., Buck B., Paffenholz J.-A., et al. (2019). Physical Modelling of Blue Mussel Dropper Lines for the Development of Surrogates and Hydrodynamic Coefficients. JMSE 7, 65. doi: 10.3390/jmse7030065
Leon J. X., Roelfsema C. M., Saunders M. I., Phinn S. R. (2015). Measuring coral reef terrain roughness using ‘Structure-from-Motion’ close-range photogrammetry. Geomorphology 242, 21–28. doi: 10.1016/j.geomorph.2015.01.030
Levy N., Berman O., Yuval M., Loya Y., Treibitz T., Tarazi E., et al. (2022). Emerging 3D technologies for future reformation of coral reefs: Enhancing biodiversity using biomimetic structures based on designs by nature. Sci. Total Environ. 830, 154749. doi: 10.1016/j.scitotenv.2022.154749
Lin J.-H., Chen G.-Y., Chen Y.-Y. (2013). Laboratory Measurement of Seabed Shear Stress and the Slip Factor over a Porous Seabed. J. Eng. Mech. 139, 1372–1386. doi: 10.1061/(ASCE)EM.1943-7889.0000569
Lindemann H., Fromm A., Ott J., Kloft H. (2017). Digital Prefabrication of freeform concrete elements using shotcrete technology. Proc. IASS Annu. Symposia IASS 2017 Hamburg Symposium: Advanced Manufacturing, 1–8.
Liu Q.-X., Doelman A., Rottschäfer V., Jager M., Herman P. M. J., Rietkerk M., et al. (2013). Phase separation explains a new class of self-organized spatial patterns in ecological systems. Proc. Natl. Acad. Sci. U.S.A. 110, 11905–11910. doi: 10.1073/pnas.1222339110
Liu Q.-X., Herman P. M. J., Mooij W. M., Huisman J., Scheffer M., Olff H., et al. (2014). Pattern formation at multiple spatial scales drives the resilience of mussel bed ecosystems. Nat. Commun. 5, 5234. doi: 10.1038/ncomms6234
Liu Q.-X., Rietkerk M., Herman P. M. J., Piersma T., Fryxell J. M., van de Koppel J. (2016). Phase separation driven by density-dependent movement: A novel mechanism for ecological patterns. Phys. Life Rev. 19, 107–121. doi: 10.1016/j.plrev.2016.07.009
Lowe R. J., Koseff J. R., Monismith S. G. (2005). Oscillatory flow through submerged canopies: 1. Velocity structure. J. Geophys. Res. 110, C10016. doi: 10.1029/2004JC002788
Lowe R. J., Falter J. L., Bandet M. D., Pawlak G., Atkinson M. J., Monismith S. G., et al. (2005). Spectral wave dissipation over a barrier reef. J. Geophys. Res. 110, C04001. doi: 10.1029/2004JC002711
Lowke D., Böhler D., Mai I. (2024). “Particle Bed 3D Printing in Construction,” in Additive Manufacturing for Construction. Eds. Panda B., Shakor P., Laghi V. (ICE publishing), 79–109, Northspring).
Lowke D., Dini E., Perrot A., Weger D., Gehlen C., Dillenburger B. (2018). Particle-bed 3D printing in concrete construction – Possibilities and challenges. Cement Concrete Res. 112, 50–65. doi: 10.1016/j.cemconres.2018.05.018
Lowke D., Mai I., Keita E., Perrot A., Weger D., Gehlen C., et al. (2022). Material-process interactions in particle bed 3D printing and the underlying physics. Cement Concrete Res. 156, 106748. doi: 10.1016/j.cemconres.2022.106748
Lowke D., Talke D., Dressler I., Weger D., Gehlen C., Ostertag C., et al. (2020). Particle bed 3D printing by selective cement activation – Applications, material and process technology. Cement Concrete Res. 134, 106077. doi: 10.1016/j.cemconres.2020.106077
Lunt J., Reustle J., Smee D. L. (2017). Wave energy and flow reduce the abundance and size of benthic species on oyster reefs. Mar. Ecol. Prog. Ser. 569, 25–36. doi: 10.3354/meps12075
Mai I., Herding F., Lowke D. (2022a). “Evaluating the Effect of Methyl Cellulose on Hardened State Properties in Selective Cement Activation,” in Third RILEM International Conference on Concrete and Digital Fabrication. Eds. Buswell R., Blanco A., Cavalaro S., Kinnell P. (Springer International Publishing, Cham), 289–295.
Mai I., Lowke D., Perrot A. (2022b). Fluid intrusion in powder beds for selective cement activation – An experimental and analytical study. Cement Concrete Res. 156, 106771. doi: 10.1016/j.cemconres.2022.106771
Mainka J., Kloft H., Baron S., Hoffmeister H.-W., Dröder K. (2016). Non-Waste-Wachsschalungen: Neuartige Präzisionsschalungen aus recycelbaren Industriewachsen. Beton- und Stahlbetonbau 111, 784–793. doi: 10.1002/best.201600055
Manis J. E., Garvis S. K., Jachec S. M., Walters L. J. (2015). Wave attenuation experiments over living shorelines over time: A wave tank study to assess recreational boating pressures. J. Coast. Conserv. 19, 1–11. doi: 10.1007/s11852-014-0349-5
Markert A. (2020). How dense is dense? Toward a harmonized approach to characterizing reefs of non-native Pacific oysters – with consideration of native mussels. NB 57, 7–52. doi: 10.3897/neobiota.57.49196
Marty A., Schoefs F., Soulard T., Berhault C., Facq J.-V., Gaurier B., et al. (2021). Effect of Roughness of Mussels on Cylinder Forces from a Realistic Shape Modelling. JMSE 9, 598. doi: 10.3390/jmse9060598
Mathisen P. P., Madsen O. S. (1999). Waves and currents over a fixed rippled bed: 3. Bottom and apparent roughness for spectral waves and currents. J. Geophys. Res. 104, 18447–18461. doi: 10.1029/1999JC900114
Mazen A., McClanahan B., Weaver J. M. (2022). Factors affecting ultimate tensile strength and impact toughness of 3D printed parts using fractional factorial design. Int. J. Adv. Manuf Technol. 119, 2639–2651. doi: 10.1007/s00170-021-08433-0
Mazzoleni M., Paron P., Reali A., Juizo D., Manane J., Brandimarte L. (2020). Testing UAV-derived topography for hydraulic modelling in a tropical environment. Nat. Hazards 103, 139–163. doi: 10.1007/s11069-020-03963-4
Miossec L., Le Dueff R.-M., Goulletquer P. (2009). Alien species alert: Crassostrea gigas (Pacific oyster). ICES Cooperative Res. Rep. No. 299, 42.
Mirfenderesk H., Young I. R. (2003). Direct measurements of the bottom friction factor beneath surface gravity waves. Appl. Ocean Res. 25, 269–287. doi: 10.1016/j.apor.2004.02.002
Monismith S. G., Koseff J. R., Thompson J. K., O'Riordan C. A., Nepf H. M. (1990). A study of model bivalve siphonal currents. Limnol. Oceanogr. 35, 680–696. doi: 10.4319/lo.1990.35.3.0680
Morris R. L., Konlechner T. M., Ghisalberti M., Swearer S. E. (2018). From grey to green: Efficacy of eco-engineering solutions for nature-based coastal defence. Glob Chang Biol. 24, 1827–1842. doi: 10.1111/gcb.14063
Morris R. L., La Peyre M. K., Webb B. M., Marshall D. A., Bilkovic D. M., Cebrian J., et al. (2021). Large-scale variation in wave attenuation of oyster reef living shorelines and the influence of inundation duration. Ecol. Appl. 31, e02382. doi: 10.1002/eap.2382
Murphy S. V., Atala A. (2014). 3D bioprinting of tissues and organs. Nat. Biotechnol. 32, 773–785. doi: 10.1038/nbt.2958
Narayan S., Beck M. W., Reguero B. G., Losada I. J., van Wesenbeeck B., Pontee N., et al. (2016). The effectiveness, costs and coastal protection benefits of natural and nature-based defences. PloS One 11, e0154735. doi: 10.1371/journal.pone.0154735
Navaratnam C. U., Aberle J. (2017). The effect of bed porosity on near-bed turbulent flow characteristics in gravel-bed rivers. Vann 52, 181–190.
Nehls G., Diederich S., Thieltges D. W., Strasser M. (2006). Wadden Sea mussel beds invaded by oysters and slipper limpets: competition or climate control? Helgolander Meeresunters 60, 135–143. doi: 10.1007/s10152-006-0032-9
Nehring S. (2011). NOBANIS - Invasive Alien Species Fact Sheet - Crassostrea gigas: From: Online Database of the European Network on Invasive Alien Species - NOBANIS (Germany: Bonn).
Ngo T. D., Kashani A., Imbalzano G., Nguyen K. T., Hui D. (2018). Additive manufacturing (3D printing): A review of materials, methods, applications and challenges. Composites Part B: Eng. 143, 172–196. doi: 10.1016/j.compositesb.2018.02.012
Nikora V. I., Goring D. G., Biggs B. J. F. (1998). On gravel-bed roughness characterization. Water Resour. Res. 34, 517–527. doi: 10.1029/97WR02886
Oertel M., Shen X. (2022). 3D Printing Technique for Experimental Modeling of Hydraulic Structures: Exemplary Scaled Weir Models. Water 14, 2153. doi: 10.3390/w14142153
Perkol-Finkel S., Hadary T., Rella A., Shirazi R., Sella I. (2018). Seascape architecture – incorporating ecological considerations in design of coastal and marine infrastructure. Ecol. Eng. 120, 645–654. doi: 10.1016/j.ecoleng.2017.06.051
Perricone V., Mutalipassi M., Mele A., Buono M., Vicinanza D., Contestabile P. (2023). Nature-based and bioinspired solutions for coastal protection: an overview among key ecosystems and a promising pathway for new functional and sustainable designs. ICES J. Mar. Sci. 80, 1218–1239. doi: 10.1093/icesjms/fsad080
Quayle D. B. (1988). Pacific Oyster Culture in British Columbia. Ottawa, Canada: Department of Fisheries and Oceans.
Raushan P. K., Paul A., Singh S. K., Debnath K. (2020). Spatially-averaged turbulent flow characteristics over ribbed surface in presence of unidirectional wave over steady current. Appl. Ocean Res. 100, 102154. doi: 10.1016/j.apor.2020.102154
Reidenbach M. A., Berg P., Hume A., Hansen J. C. R., Whitman E. R. (2013). Hydrodynamics of intertidal oyster reefs: The influence of boundary layer flow processes on sediment and oxygen exchange. Limnol. Oceanogr. 3, 225–239. doi: 10.1215/21573689-2395266
Reidenbach M. A., Monismith S. G., Koseff J. R., Yahel G., Genin A. (2006). Boundary layer turbulence and flow structure over a fringing coral reef. Limnol. Oceanogr. 51, 1956–1968. doi: 10.4319/lo.2006.51.5.1956
Reis B., van der Linden P., Pinto I. S., Almada E., Borges M. T., Hall A. E., et al. (2021). Artificial reefs in the North –East Atlantic area: Present situation, knowledge gaps and future perspectives. Ocean Coast. Manage. 213, 105854. doi: 10.1016/j.ocecoaman.2021.105854
Reise K. (1998). Pacific Oysters Invade Mussel Beds in the European Wadden Sea. Senckenberg. marit. 28, 167–175. doi: 10.1007/BF03043147
Reise K., Buschbaum C., Büttger H., Rick J., Wegner K. M. (2017). Invasion trajectory of Pacific oysters in the northern Wadden Sea. Mar. Biol. 164, 68. doi: 10.1007/s00227-017-3104-2
Salaün J., Pioch S., Dauvin J.-C. (2020). “Artificial reef along the French Mediterranean coastline: toward innovative integrated biodiversity management,” in Eighth International Symposium “Monitoring of Mediterranean Coastal Areas. Problems and Measurement Techniques”. Eds. Bonora L., Carboni D., de Vincenzi M. (Firenze University Press, Florence), 309–315.
Sansom B. J., Atkinson J. F., Bennett S. J. (2018). Modulation of near-bed hydrodynamics by freshwater mussels in an experimental channel. Hydrobiologia 810, 449–463. doi: 10.1007/s10750-017-3172-9
Schubert N., Schoenrock K. M., Aguirre J., Kamenos N. A., Silva J., Horta P. A., et al. (2020). Editorial: Coralline Algae: Globally Distributed Ecosystem Engineers. Front. Mar. Sci. 7. doi: 10.3389/fmars.2020.00352
Seed R. (1968). Factors Influencing Shell Shape in the Mussel Mytilus Edulis. J. Mar. Biol. Ass. 48, 561–584. doi: 10.1017/S0025315400019159
Seed R., Suchanek T. (1992). Population and communtiy ecology of Mytilus. Developments Aquaculture Fisheries Sci.. ed. Gosling E. M. (London, UK: Elsevier). 87–169.
Sella I., Perkol-Finkel S. (2015). Blue is the new green – Ecological enhancement of concrete based coastal and marine infrastructure. Ecol. Eng. 84, 260–272. doi: 10.1016/j.ecoleng.2015.09.016
Shavit U., Mass T., Genin A. (2022). The Small-Scale Flow Field Around Dipsastraea favus Corals. Front. Mar. Sci. 9. doi: 10.3389/fmars.2022.857109
Sherratt J. A., Mackenzie J. J. (2016). How does tidal flow affect pattern formation in mussel beds? J. Theor. Biol. 406, 83–92. doi: 10.1016/j.jtbi.2016.06.025
Shounda J., Barman K., Debnath K. (2023). Effect of wave-current flow on double-averaged turbulence properties over rough bed of hemispherical obstacles. Coast. Eng. J. 65, 572–596. doi: 10.1080/21664250.2023.2288427
Singh S. K., Debnath K., Mazumder B. S. (2016). Spatially-averaged turbulent flow over cubical roughness in wave-current co-existing environment. Coast. Eng. 114, 77–85. doi: 10.1016/j.coastaleng.2016.04.013
Smaal A. C., Stralen M., Craeymeersch J. (2005). “Does the introduction of the Pacific oyster Crassostrea gigas lead to species shifts in the Wadden Sea?,” in The Comparative Roles of Suspension-Feeders in Ecosystems, vol. 47 . Eds. Dame R. F., Olenin S. (NATO Science Series IV: Earth and Environmental Series), 277–289. doi: 10.1007/1-4020-3030-4_16
Solan M., Spencer T., Paterson D. M., Unsworth C. A., Christie E. K., Blight A. J., et al. (2023). Biological-physical interactions are fundamental to understanding and managing coastal dynamics. R Soc. Open Sci. 10, 230155. doi: 10.1098/rsos.230155
Stewart M. T., Cameron S. M., Nikora V. I., Zampiron A., Marusic I. (2019). Hydraulic resistance in open-channel flows over self-affine rough beds. J. Hydraulic Res. 57, 183–196. doi: 10.1080/00221686.2018.1473296
Stocking J. B., Laforsch C., Sigl R., Reidenbach M. A. (2018). The role of turbulent hydrodynamics and surface morphology on heat and mass transfer in corals. J. R Soc. Interface 15, 20180448. doi: 10.1098/rsif.2018.0448
Strusińska-Correia A., Husrin S., Oumeraci H. (2013). Tsunami damping by mangrove forest: a laboratory study using parameterized trees. Nat. Hazards Earth Syst. Sci. 13, 483–503. doi: 10.5194/nhess-13-483-2013
Talke D., Saile B., Meier N., Herding F., Mai I., Zetzener H., et al. (2023). Particle-bed 3D printing by selective cement activation – Influence of process parameters on particle-bed density. Cement Concrete Res. 168, 107140. doi: 10.1016/j.cemconres.2023.107140
Taylor J., Bushek D. (2008). Intertidal oyster reefs can persist and function in a temperate North American Atlantic estuary. Mar. Ecol. Prog. Ser. 361, 301–306. doi: 10.3354/meps07429
Telesca L., Michalek K., Sanders T., Peck L. S., Thyrring J., Harper E. M. (2018). Blue mussel shell shape plasticity and natural environments: a quantitative approach. doi: 10.17863/CAM.17628
Thunberg C. P. (1793). Tekning och beskrifning pa˚ en stor ostronsort ifra˚n japan. Kongliga Vetenskaps Academiens Nya Handlingar 14, 140–142.
Tibabuzo Perdomo A. M., Alberts E. M., Taylor S. D., Sherman D. M., Huang C.-P., Wilker J. J. (2018). Changes in Cementation of Reef Building Oysters Transitioning from Larvae to Adults. ACS Appl. Mater. Interfaces 10, 14248–14253. doi: 10.1021/acsami.8b01305
UNESCO (2022) World Heritage List. Available online at: https://whc.unesco.org/en/list/ (Accessed April 04, 2022).
van de Koppel J., Gascoigne J. C., Theraulaz G., Rietkerk M., Mooij W. M., Herman P. M. J. (2008). Experimental evidence for spatial self-organization and its emergent effects in mussel bed ecosystems. Science 322, 739–742. doi: 10.1126/science.1163952
van de Koppel J., Rietkerk M., Dankers N., Herman P. M. J. (2005). Scale-dependent feedback and regular spatial patterns in young mussel beds. Am. Nat. 165, E66–E77. doi: 10.1086/428362
van Duren L. A., Herman P. M., Sandee A. J., Heip C. H. (2006). Effects of mussel filtering activity on boundary layer structure. J. Sea Res. 55, 3–14. doi: 10.1016/j.seares.2005.08.001
van Leeuwen B., Augustijn D., van Wesenbeeck B. K., Hulscher S., Vries M.B.de (2010). Modeling the influence of a young mussel bed on fine sediment dynamics on an intertidal flat in the Wadden Sea. Ecol. Eng. 36, 145–153. doi: 10.1016/j.ecoleng.2009.01.002
van Rooijen A., Lowe R. J., Rijnsdorp D. P., Ghisalberti M., Jacobsen N. G., McCall R. (2020). Wave-Driven Mean Flow Dynamics in Submerged Canopies. J. Geophys. Res. 125, 57. doi: 10.1029/2019JC015935
Wang R.-H., Liu Q.-X., Sun G.-Q., Jin Z., van de Koppel J. (2009). Nonlinear dynamic and pattern bifurcations in a model for spatial patterns in young mussel beds. J. R Soc. Interface 6, 705–718. doi: 10.1098/rsif.2008.0439
Weger D., Pierre A., Perrot A., Kränkel T., Lowke D., Gehlen C. (2021). Penetration of Cement Pastes into Particle-Beds: A Comparison of Penetration Models. Materials (Basel) 14, 389. doi: 10.3390/ma14020389
Wehrmann A. (2003). Biogenic and taphonomic processes affecting the development of shell assemblages: an actuopaleontological case study from mussel banks on North Sea tidal flats. Facies 49, 19–30. doi: 10.1007/s10347-003-0022-1
Wehrmann A., Herlyn M., Bungenstock F., Hertweck G., Millat G. (2000). The distribution gap is closed — First record of naturally settled pacific oysters Crassostrea gigas in the East Frisian Wadden Sea, North Sea. Senckenberg. marit. 30, 153–160. doi: 10.1007/BF03042964
Westoby M. J., Brasington J., Glasser N. F., Hambrey M. J., Reynolds J. M. (2012). ‘Structure-from-Motion’ photogrammetry: A low-cost, effective tool for geoscience applications. Geomorphology 179, 300–314. doi: 10.1016/j.geomorph.2012.08.021
Whitman E. R., Reidenbach M. A. (2012). Benthic flow environments affect recruitment of Crassostrea virginica larvae to an intertidal oyster reef. Mar. Ecol. Prog. Ser. 463, 177–191. doi: 10.3354/meps09882
Wiberg P. L., Taube S. R., Ferguson A. E., Kremer M. R., Reidenbach M. A. (2019). Wave attenuation by oyster reefs in shallow coastal bays. Estuaries Coasts 42, 331–347. doi: 10.1007/s12237-018-0463-y
Widdows J., Lucas J. S., Brinsley M. D., Salkeld P. N., Staff F. J. (2002). Investigation of the effects of current velocity on mussel feeding and mussel bed stability using an annular flume. Helgolander Meeresunters 56, 3–12. doi: 10.1007/s10152-001-0100-0
Widdows J., Pope N. D., Brinsley M. D., Gascoigne J., Kaiser M. J. (2009). Influence of self-organised structures on near-bed hydrodynamics and sediment dynamics within a mussel (Mytilus edulis) bed in the Menai Strait. J. Exp. Mar. Biol. Ecol. 379, 92–100. doi: 10.1016/j.jembe.2009.08.017
Wu P., Wang J., Wang X. (2016). A critical review of the use of 3-D printing in the construction industry. Automation Construction 68, 21–31. doi: 10.1016/j.autcon.2016.04.005
Yao Y., Yang X., Liu W., He T. (2020). The effect of reef roughness on monochromatic wave breaking and transmission over fringing reefs. Mar. Georesources Geotechnol. 29, 1–11. doi: 10.1080/1064119X.2019.1702746
Yuan J., Madsen O. S. (2014). Experimental study of turbulent oscillatory boundary layers in an oscillating water tunnel. Coast. Eng. 89, 63–84. doi: 10.1016/j.coastaleng.2014.03.007
Zeinoddini M., Bakhtiari A., Schoefs F., Zandi A. P. (2017). Towards an understanding of marine fouling effects on the vortex-induced vibrations of circular cylinders: partial coverage issue. Biofouling 33, 268–280. doi: 10.1080/08927014.2017.1291803
Zhu L., Chen Q., Wang H., Capurso W., Niemoczynski L., Hu K., et al. (2020). Field observations of wind waves in upper Delaware Bay with living shorelines. Estuaries Coasts 43, 739–755. doi: 10.1007/s12237-019-00670-7
Keywords: experimental modeling, bed roughness, digital fabrication, additive manufacturing, particle bed 3D printing, Wadden Sea, intertidal, coastal habitats
Citation: Hitzegrad J, Brohmann L, Herding F, Pfennings K, Jonischkies S, Scharnbeck E, Mainka J, Mai I, Windt C, Kloft H, Wehrmann A, Lowke D and Goseberg N (2024) Surfaces of coastal biogenic structures: exploiting advanced digital design and fabrication strategies for the manufacturing of oyster reef and mussel bed surrogates. Front. Mar. Sci. 11:1395025. doi: 10.3389/fmars.2024.1395025
Received: 02 March 2024; Accepted: 09 April 2024;
Published: 23 April 2024.
Edited by:
Matteo Postacchini, Marche Polytechnic University, ItalyReviewed by:
Eleonora Perugini, University of Strathclyde, United KingdomMartin Coombes, University of Oxford, United Kingdom
Copyright © 2024 Hitzegrad, Brohmann, Herding, Pfennings, Jonischkies, Scharnbeck, Mainka, Mai, Windt, Kloft, Wehrmann, Lowke and Goseberg. This is an open-access article distributed under the terms of the Creative Commons Attribution License (CC BY). The use, distribution or reproduction in other forums is permitted, provided the original author(s) and the copyright owner(s) are credited and that the original publication in this journal is cited, in accordance with accepted academic practice. No use, distribution or reproduction is permitted which does not comply with these terms.
*Correspondence: Jan Hitzegrad, j.hitzegrad@tu-braunschweig.de