

Abstract
Diesel particulate matter (DPM) and hydrocarbons (HCs) emitted from diesel engines have a negative affect on air quality and human health. Catalysts for oxidative removal of DPM and HCs are currently used universally but their low removal efficiency at low temperatures is a problem. In this study, Cu-doped CeO2 loaded on Al2O3 coupled with plasma was used to enhance low-temperature oxidation of DPM and HCs. Removals of DPM and HCs at 200 °C using the catalyst were as high as 90% with plasma but below 30% without plasma. Operando plasma diffuse reflectance infrared Fourier transform spectroscopy coupled with mass spectrometry was conducted to reveal the functional mechanism of the oxygen species in the DPM oxidation process. It was found that Cu–CeO2 can promote the formation of adsorbed oxygen ( –
– ) and terminal oxygen (M=O), which can react with DPM to form carbonates that are easily converted to gaseous CO2. Our results provide a practical plasma catalysis technology to obtain simultaneous removals of DPM and HCs at low temperatures.
Export citation and abstract BibTeX RIS
1. Introduction
As a main power supply for cars, trucks, trains, ships, construction machines and electric power generators, diesel engines account for in excess of 12% of annual global energy use [1, 2] and emit pollutants such as diesel particulate matter (DPM), which threatens the environment and human health [3, 4]. DPM is generally a mixture of soot and organic and inorganic compounds, which lower the air quality [5, 6]. Increasingly stringent DPM emission regulations have been introduced by governments worldwide in the past decades [7]. The China Ⅵ emission standard has been in force since July 2021, in which the DPM emission level is 67% lower than that in the China Ⅴ standard [8].
To comply with these strict standards, researchers have made great efforts to develop DPM control technologies such as using blended fuel, low-ash lubricant, pre-combustion and after-treatment [9]. A widely used technology is diesel particulate filters (DPFs) to trap DPM from the exhaust gases. Periodical regeneration of a DPF is required to remove accumulated DPM and reduce the excessive backpressure [10]. The exhaust gas temperature of a diesel engine is generally between 100 °C and 400 °C, insufficient to burn DPM completely [11, 12]. Thus, regeneration of DPFs by heating the accumulated DPM to above 600 °C is used to enhance DPM combustion, but this thermal combustion regeneration also has a fuel penalty.
In order to lower the combustion temperature of DPM, numerous catalysts have been developed, and platinum-based catalysts have been successfully applied for exhaust treatment [13]. Recently, ceria-based catalysts have been found to be promising candidates to replace noble metal catalysts [14]. Cerium oxide (CeO2) has a high oxygen storage capacity and oxygen mobility for catalysis [15]. Copper oxide (CuO) has unique electrical, magnetic and catalytic properties [16]. Copper doping into CeO2 (Cu–CeO2) can generate abundant structure defects that can enhance catalytic oxidation activity [17, 18]. According to the literature, many studies on designing Cu–CeO2 catalysts suggest that it is possible to obtain a catalyst with selective exposed crystal facets, a three-dimensionally ordered macroporous structure, particle-based and with a nanoarray structure [19, 20]. Furthermore, Cu–CeO2 catalyst with an Cu/Ce atomic ratio of 1 is most active in catalyzing the combustion of diesel soot [21]. γ-Al2O3 is extensively used as a catalyst support in the automotive industries due to its high specific surface area, high porosity and excellent thermal stability [22, 23]. The common methods for preparation of supported catalysts are impregnation, deposition–precipitation and mechanical grinding, among which the grinding method has the advantages of simplicity, rapidity, no usage of solvent, environmental friendliness and energy conservation [24]. Although catalyst technologies have been continuously improved, the temperature for catalytically combusting 50% of DPM is still higher than 350 °C, frequently above the exhaust gas temperature [25]. Therefore, under normal diesel engine working conditions, many DPM particles still inevitably accumulate in the DPF, even though catalysts have been incorporated within it.
Non-thermal plasma (NTP) technology offers an innovative process for low-temperature DPM oxidation because active oxygen species (O,  OH and O3) produced in the discharge space can be effectively used at low temperatures [26, 27]. A dielectric barrier discharge (DBD) reactor has a uniform and stable discharge space, and possesses broad prospects for industrial application [28]. There have been some studies on DPM oxidation using a DBD reactor with a catalyst [29]. Recent reports show that a significant synergistic effect can be obtained using a hybrid process of NTP and catalysis for DPM oxidation [30, 31]. DPM removal efficiency can be enhanced by up to 77% using a plasma reactor hybrid with metal oxide catalysts at a temperature lower than 350 °C, while thermal catalytic DPM oxidation without plasma is almost negligible [32].
In this study, a DBD reactor hybrid with Cu–CeO2 catalyst was designed to investigate the oxidation properties of DPM particles in an exhaust gas from a diesel burner. The functional mechanism of surface oxygen species during DPM plasma oxidation on Cu–CeO2 catalyst was studied using operando plasma diffuse reflectance infrared Fourier transform spectroscopy (DRIFTS) with mass spectrometry (MS).
2. Experimental methods
2.1. Catalyst preparation
The metal oxide catalysts Cu–CeO2, CuO and CeO2 were prepared using the ultrasonic aerosol pyrolysis (UAP) method (figure S1). A certain amount of copper and cerium nitrates (Shanghai Macklin, China) were dissolved in deionized water in which an ultrasonic atomization unit was installed. The atomized mists were heated to 70 °C and sent into a quartz tube reactor with N2 (0.8 L min–1) for thermal decomposition at 600 °C. The decomposition products were collected with a water absorption bottle and separated using a centrifuge (TG16-WS, Liangyou Instruments, China) operated at 10 000 rpm for 4 min. The solid precipitates were washed with deionized water four times and ethanol once, and dried at 80 °C for 10 h.
As a Cu/Ce atomic ratio of 1 has the best performance on diesel soot combustion [21], Cu–CeO2 with an atomic Cu/Ce ratio of 1:1 was prepared by controlling the amounts of copper and cerium nitrates.
γ-Al2O3 balls (diameter between 1.0 and 1.6 mm; Jiuzhou Chemicals, China) were used as the catalyst carrier. Cu–CeO2/Al2O3 was made by grinding Cu–CeO2 powder with γ-Al2O3 balls (mass ratio 1:10) [33]. CuO/Al2O3 and CeO2/Al2O3 were also prepared by mixing CuO and CeO2 catalysts with γ-Al2O3 balls (mass ratio 1:10) using the same grinding method.
2.2. DPM and catalyst characterization
The oxidation properties of the DPM during heating from 25 °C to 800 °C at a heating rate of 10 °C min–1 in an Ar-balanced 10% O2 atmosphere were tested using a thermogravimetric (TG) analyzer (LABSYS evo, SETARAM Instrumentation, France) equipped with a mass spectrometer (LC-D200, Tilon, USA).
Catalyst characterization details are provided in the Supplementary Material.
2.3. DPM and hydrocarbon removal evaluation
Figure 1 shows a plasma catalysis experimental system for DPM removal. The system mainly consists of DPM generation, DBD reactor and detection units. The DPM was generated by burning diesel fuel (0#, China 6 standard, SINOPEC, China) in a diesel burner fed with 1.5 L min–1 air [34]. The exhaust gas was stabilized with a buffer tank and supplied to the DBD reactor (figure S2). The tubular furnace, pulse power supply, voltage probe, current probe, oscilloscope and definitions of discharge power and energy density (ED) were as per the literature [35]. Typical discharge waveforms are illustrated in figure S3, showing that the voltage pulse had a rise time and pulse width of 40 µs and 50 µs, respectively.
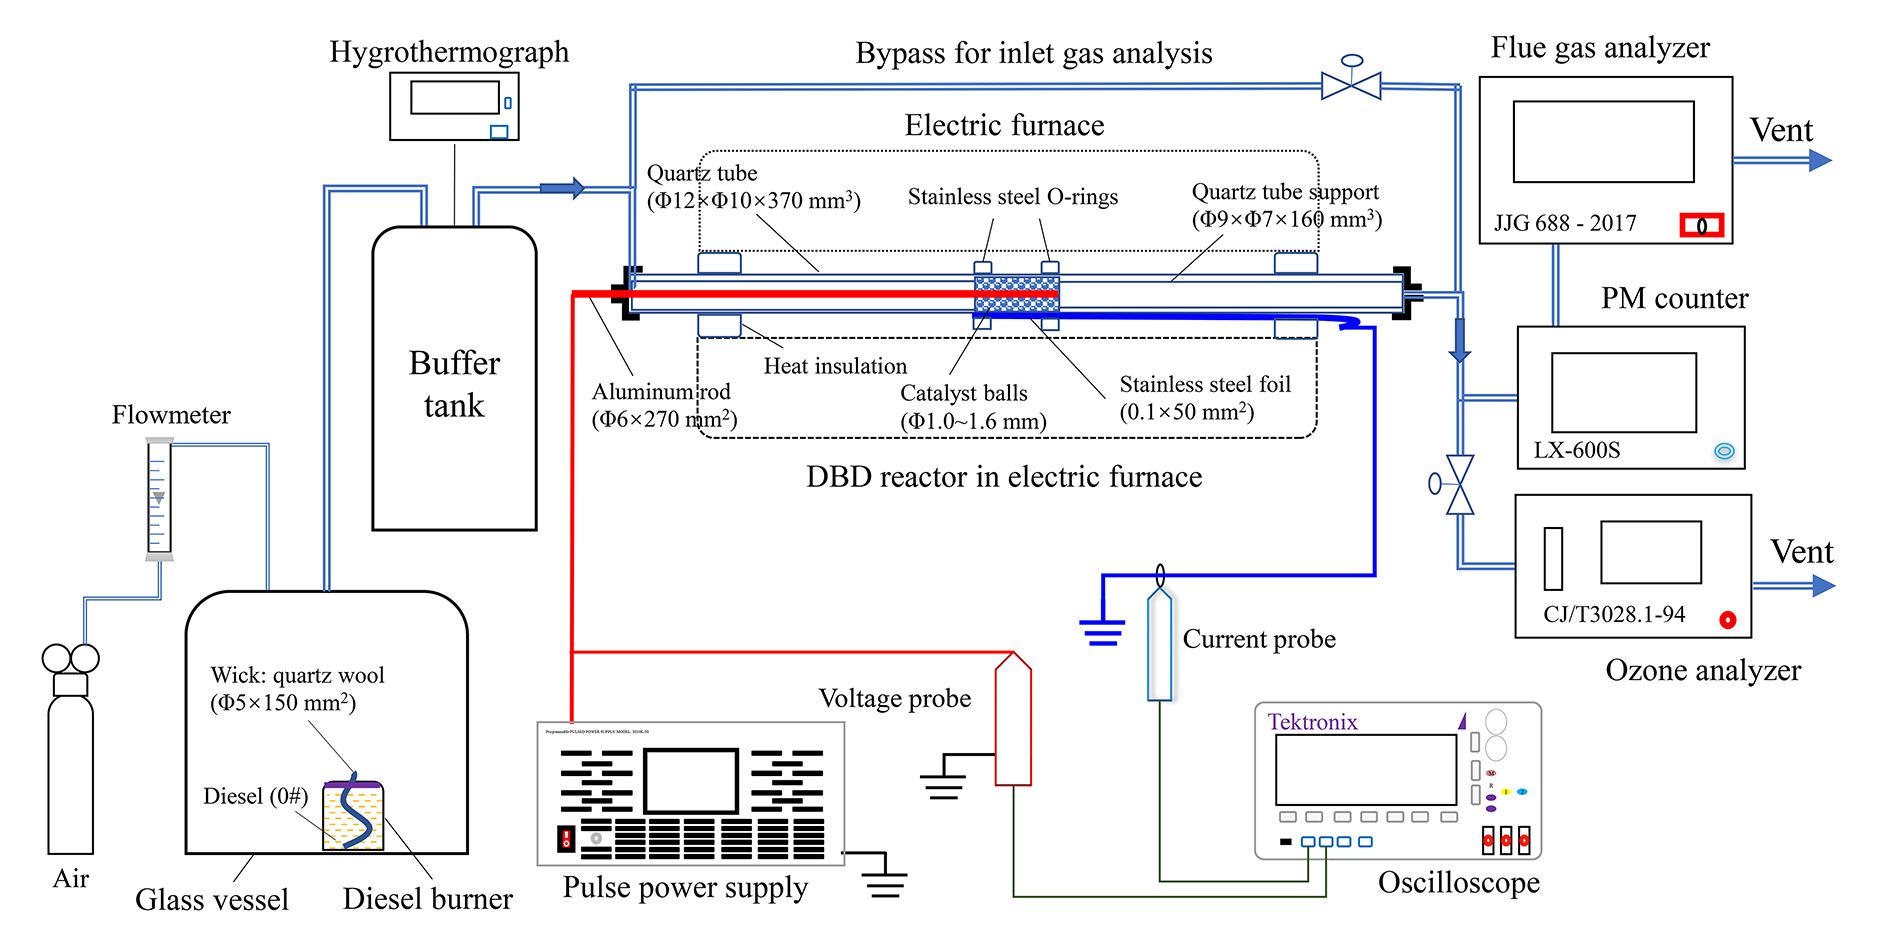
Fig. 1 Plasma-catalysis experimental system for DPM removal.
Download figure:
Standard imageThe DPM mass concentrations in the exhaust gas were detected using a PM counter (LX-600S, Jiangsu Lingxi, China) based on laser scattering; similar measurements were reported by Ni et al [36].
An ozone analyzer (BMOZ-200T, Shengxin, China) was used to detect the ozone (O3) concentration in the exhaust gas. A flue gas analyzer (HPC500, Mincee, China) satisfying China standard JJG 688-2017 'Vehicle Exhaust Emissions Measuring Instruments' was used to detect the concentrations of hydrocarbons (HCs, equivalent to propane), CO, CO2, O2 and NO in the exhaust gas. The concentration data were automatically collected every 0.54 s.
DPM removal (X) was defined as

Here, Cin and Cout are DPM concentrations in µg m–3 at the inlet and outlet of the DBD reactor, respectively.
3. Results and discussion
3.1. DPM oxidation
DPM samples were collected from the buffer tank (figure 1), and the oxidation properties in 10% O2 atmosphere (Ar balance, 100 mL min–1) were analyzed using TG-MS. The T10, T50 and T90 values (the temperatures at which 10%, 50% and 90% of DPM were removed) are 290 °C, 628 °C and 700 °C, respectively (figure 2(a)), close to those of a DPM from a real diesel engine [37]. The main oxidation products of the DPM are CO2 and CO (figure 2(b)), proving that the major component of DPM is carbon.

Fig. 2 The TG-MS curves. (a) DPM removal (weight loss percentage) and (b) CO2 and CO MS signals within 25 °C and 800 °C in 10% O2/Ar (100 mL min–1).
Download figure:
Standard image3.2. DPM and HC removals
3.2.1. Synergy effect on DPM and HC plasma catalysis oxidation
Figure 3(a) shows the DPM and HC removal efficiencies with different catalysts with and without plasma at 200 °C. When γ-Al2O3, CeO2/Al2O3, CuO/Al2O3 and Cu–CeO2/Al2O3 are used without plasma, DPM removals are 10%, 22%, 24% and 29%, respectively; HC removals are 12%, 24%, 26% and 30%, respectively. When coupling with plasma, DPM removals increase to 27%, 75%, 55% and 90%, respectively, while HC removals increase to 25%, 70%, 60% and 92%, respectively. The DPM and HC removals on CeO2/Al2O3, CuO/Al2O3 and Cu–CeO2/Al2O3 are higher than that on γ-Al2O3, implying CeO2, CuO and Cu–CeO2 can enhance oxidation of DPM and HCs. The DPM and HC removals are only improved by 18%‒19% using Cu–CeO2/Al2O3 catalyst without plasma compared with γ-Al2O3, and by 63%‒67% with plasma, proving that the plasma coupled with Cu–CeO2 catalyst can obviously enhance DPM and HC removals. The DPM and HC removal on Cu–CeO2/Al2O3 are obviously higher than on CeO2/Al2O3 and CuO/Al2O3, indicating that a synergistic effect for DPM catalytic oxidation can be obtained by doping Cu into CeO2. DPM and HCs can be removed efficiently and simultaneously over Cu–CeO2/Al2O3 catalyst coupled with DBD plasma at 200 °C.
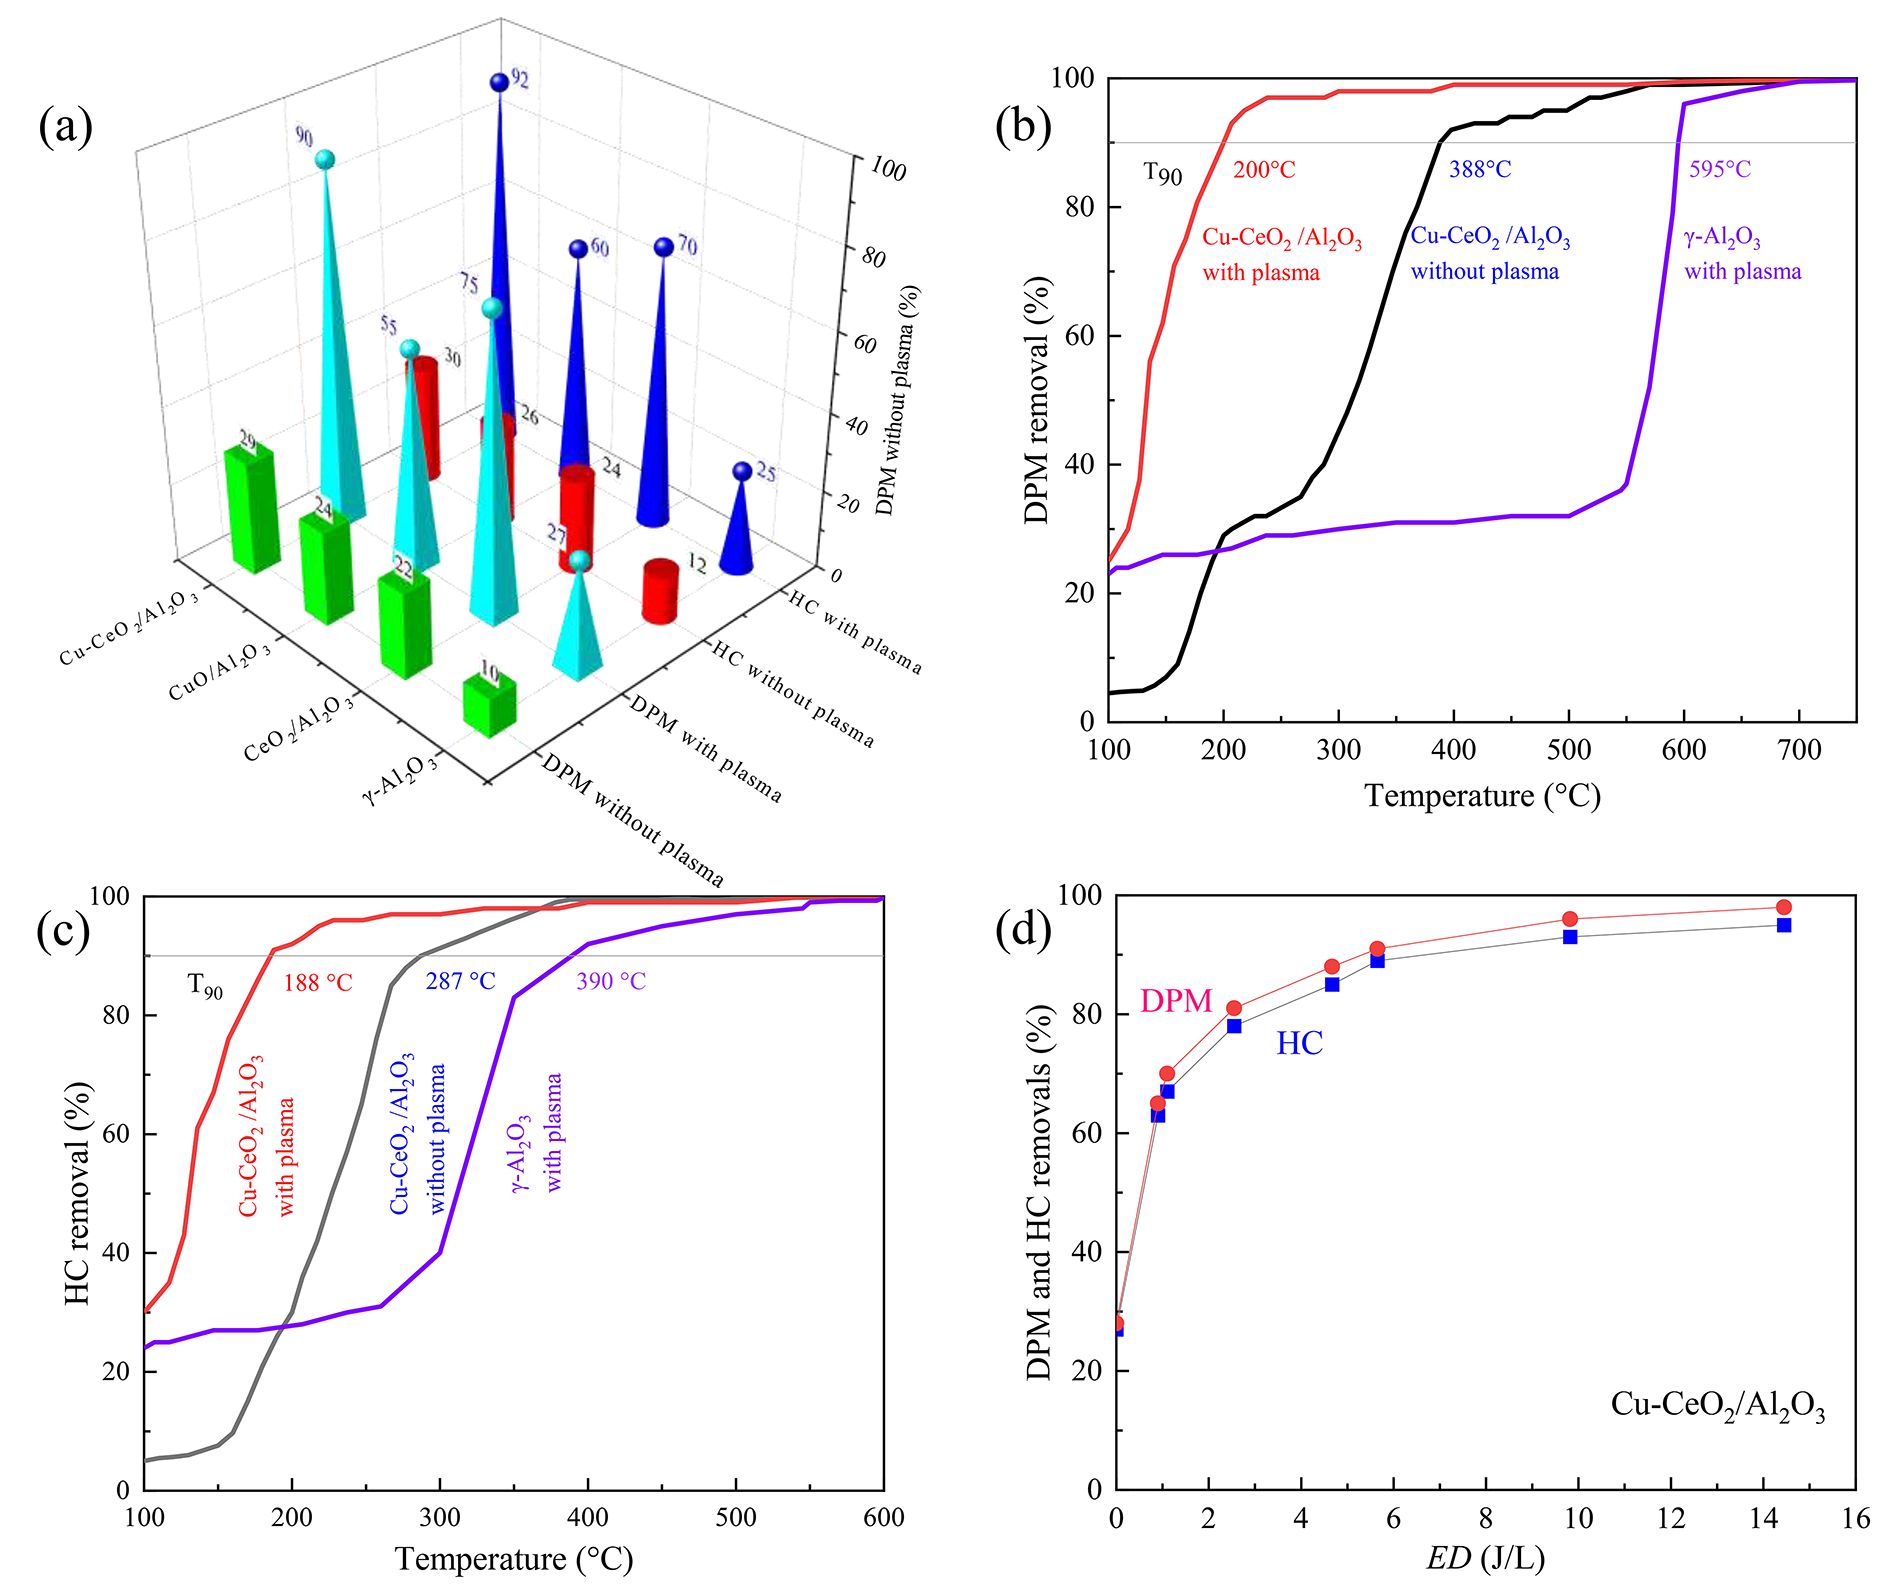
Fig. 3 (a) Comparison of DPM and HC removals on different catalysts at 200 °C. (b) DPM removal and (c) HC removal as functions of temperature on Cu–CeO2/Al2O3 and γ-Al2O3 without plasma (0 J L–1) and with plasma (9.8 J L–1). (d) DPM and HC removals versus energy density (ED) on Cu–CeO2/Al2O3 at 200 °C.
Download figure:
Standard image3.2.2. Effect of reaction temperature
For the further study of the influence of reaction temperature on DPM and HC removals on Cu–CeO2/Al2O3 catalyst with and without plasma, DPM and HC removal at various reaction temperatures was investigated (figures 3(b) and (c)). When using the DBD plasma with γ-Al2O3, DPM and HC removals are enhanced by up to 20%‒30% between 100 °C and 300 °C, and T90 values decrease to 595 °C (for DPM) and 390 °C (for HC). When using Cu–CeO2/Al2O3 without plasma, DPM and HC removals increase with temperature, and T90 values for DPM and HC decrease to 388 °C and 287 °C, respectively. When using Cu–CeO2/Al2O3 with plasma, DPM and HC removals increase with increasing temperature with a T90 value lower than 200 °C. At 200 °C, DPM removal on Cu–CeO2/Al2O3 with plasma is significantly higher than the sum of 27% (γ-Al2O3 with plasma) and 29% (Cu–CeO2/Al2O3 without plasma), indicating that plasma and Cu–CeO2/Al2O3 have a synergistic effect on DPM removal.
3.2.3. Influence of ED
Figure 3(d) plots the influence of ED on DPM and HC removals on Cu–CeO2/Al2O3 at 200 °C. DPM and HC removal increases with increasing ED. When ED is about 7 J L–1, both DPM and HC removal reach 90% (ED90 ~ 7 J L–1). Although DPM removal can be kept at a higher level at a higher ED, a higher ED means greater consumption of electrical energy. For example, 100 W discharge energy is required to treat the exhaust gas (100 L s–1) from a conventional diesel engine of 6 L displacement volume for every unit ED (1 J L–1). Therefore, it is necessary to improve DPM removal at a minimized ED. In this study, simultaneous removal of 90% DPM and HC is achieved steadily and persistently when the ED is at a practical level no higher than 9.8 J L–1 (980 W for a 6 L diesel engine).
3.2.4. By-products of O3 and NOx
As oxidative removals of DPM and HCs are driven by DBD plasma, O3 is simultaneously generated as a by-product; this has a strong oxidation potential and is involved in combustion enhancement [38]. When the ED is 9.8 J L–1, the O3 concentration decreases from about 60 ppm at 60 °C to 0 at 230 °C on Al2O3, and from about 15 ppm at 60 °C to 0 at 180 °C on Cu–CeO2/Al2O3 (figure 4). These results show that O3 decomposition efficiency on Cu–CeO2 catalyst is higher than that on Al2O3, implying that Cu–CeO2 catalyst can improve the interaction of O3 with DPM [39]. Cu–CeO2 catalyst can promote O3 decomposition and dissociative adsorption (equations (
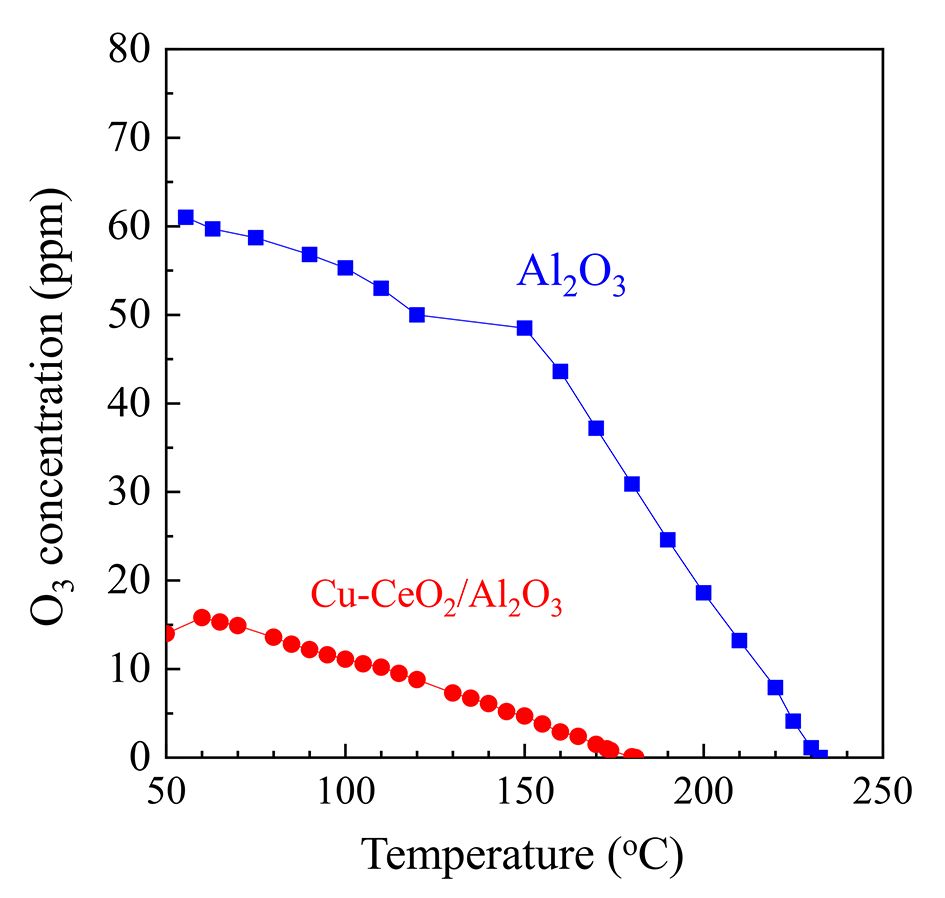
Fig. 4 O3 concentration at various temperatures during DPM oxidation on Cu–CeO2/Al2O3 and Al2O3 with plasma (9.8 J l–1).
Download figure:
Standard image


NOx is a notable by-product from air plasma. Figure S5 shows the concentration of NOx as a function of ED and temperature. At 200 °C, NOx formation can be found at an ED higher than 20 J L–1 (figure S5(a)). When ED is fixed at 9.8 J L–1, the NOx concentration increases significantly at temperatures above 225 °C (figure S5(b)). Temperature is the main factor contributing to NOx formation when using DBD plasma. Special attention should be paid to NOx generation under discharge conditions above 225 °C.
3.2.5. Long-term stability evaluation
Figure 5 shows the results of a long-term stability evaluation of DPM removal on Cu–CeO2/Al2O3. DPM concentration was reduced gradually from 1550 µg m–3 (inlet concentration) to 220 µg m–3 (outlet concentration) after 25 min without plasma (figure 5(a)). The decrease in DPM concentration was due to the accumulation of DPM on the catalyst surface, which resulted in high pressure of the buffer tank upstream of the DBD reactor. DPM concentration decreased rapidly from 1580 µg m–3 to 155 µg m–3 with a stable time duration of around 10 h with plasma (figure 5(b)). Meanwhile, HC concentration also decreased from 190 ppm to 15 ppm with a 92% reduction, but the concentrations of O2, CO2, CO and NO did not change obviously (figures 5(c) and (d)). During the 10 h discharge duration, DPM and HC concentrations were kept at low levels. These results showed that the DBD reactor coupled with Cu–CeO2/Al2O3 could simultaneously remove DPM and HC with a stable removal performance.

Fig. 5 Long-term evaluation of DPM and HC removals on Cu–CeO2/Al2O3. DPM concentration versus time (a) without plasma and (b) with plasma. (c) HC and NO and (d) O2, CO2 and CO concentrations as functions of time. Experimental conditions: air flow rate is 1.5 L min–1, temperature is 200 °C, relative humidity is 90%, ED values are 0 J L–1 (without plasma) and 9.8 J L–1 (with plasma).
Download figure:
Standard image3.3. Catalyst characterization
3.3.1. Morphologies
Figures 6(a)–(c) show the morphologies of the catalysts. Each catalyst is mainly composed of microspheres with hollow cavities and uniform particle sizes of 1–2 µm. Catalysts with hollow nano- and microstructures can be prepared by spray techniques [42] due to the decomposition of nitrate precursor aerosols to nanoparticle aerosols and aggregation of the nanoparticle aerosols to microspheres with hollow cavities with or without rupture. Figure 6(d) shows the scanning electron microscopy (SEM) energy dispersive x-ray spectroscopy (SEM-EDS) mapping image of Cu–CeO2 catalyst, which displays that each element of Cu–CeO2 is evenly distributed on the catalyst. Figure S4 shows the morphology of the Cu–CeO2 catalyst after reaction. Hollow microspheres of Cu–CeO2 can be found with a diameter less than 0.5 µm, but many nanoparticles can also be observed. As the Cu–CeO2 catalyst has a stable DPM and HC removal performance, the observed nanoparticles might be generated from hollow microspheres or Al2O3 due to grinding of the catalyst balls to powder before SEM analysis.
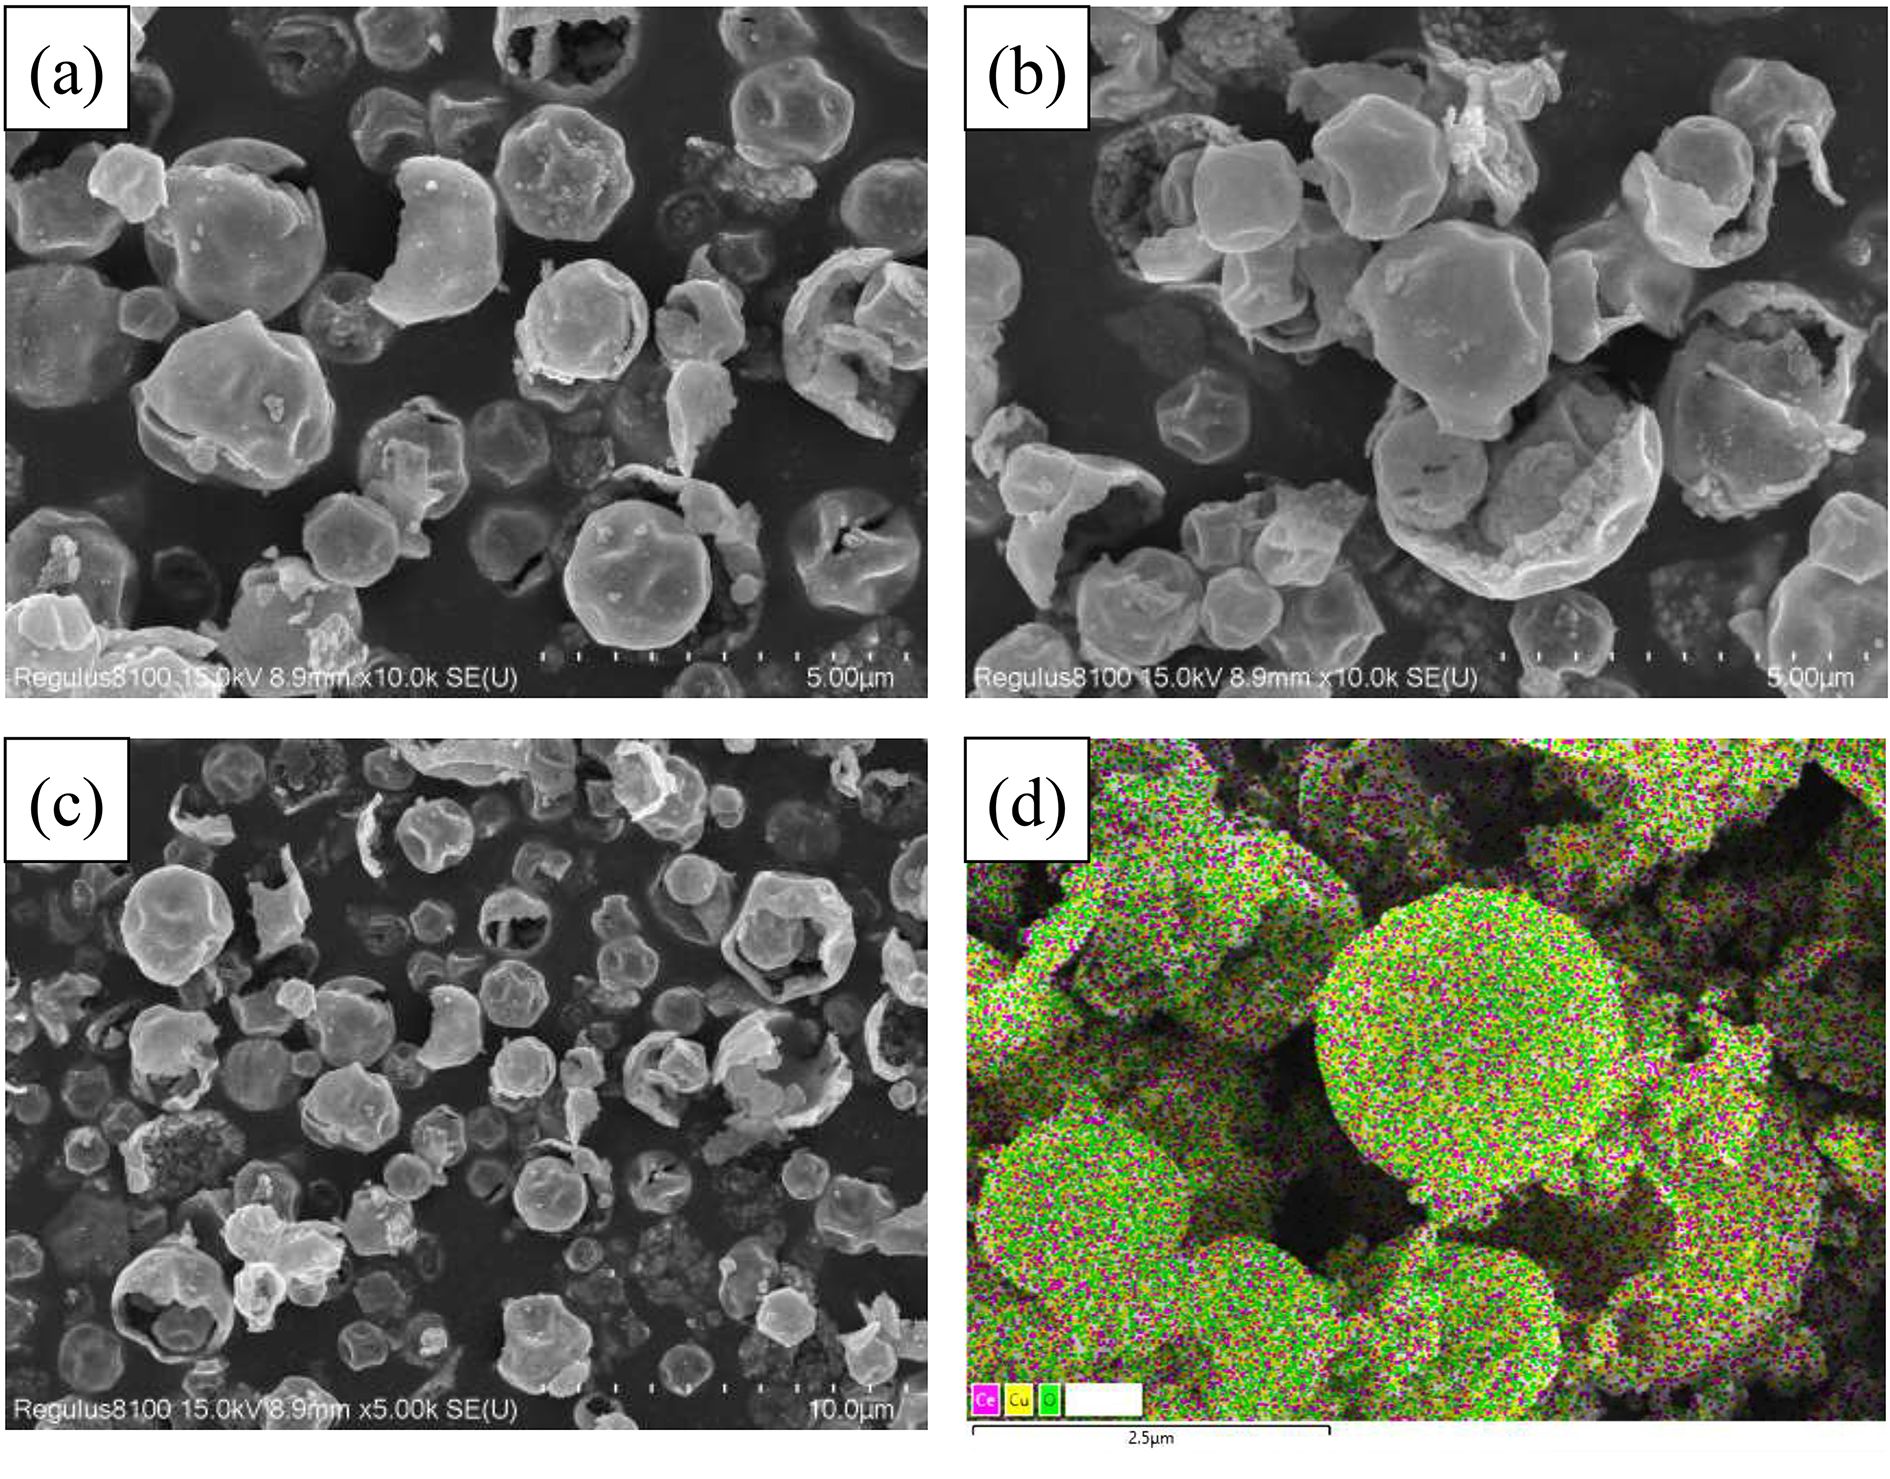
Fig. 6 SEM images of the catalysts prepared by the UAP method: (a) CeO2, (b) CuO, (c) Cu–CeO2. (d) EDS mapping images of Ce, Cu and O elements on Cu–CeO2.
Download figure:
Standard imageFigure 7 reveals the high-resolution transmission electron microscope (HRTEM) images of the catalysts. Three kinds of lattice fringes of 0.27, 0.31 and 0.23 nm can be ascribed to CeO2 (200), CeO2 (111) and CuO (111), respectively [16]. The exposed (200) crystal facet of CeO2 in Cu–CeO2 can display better catalytic activities than other facets in soot oxidation [20].
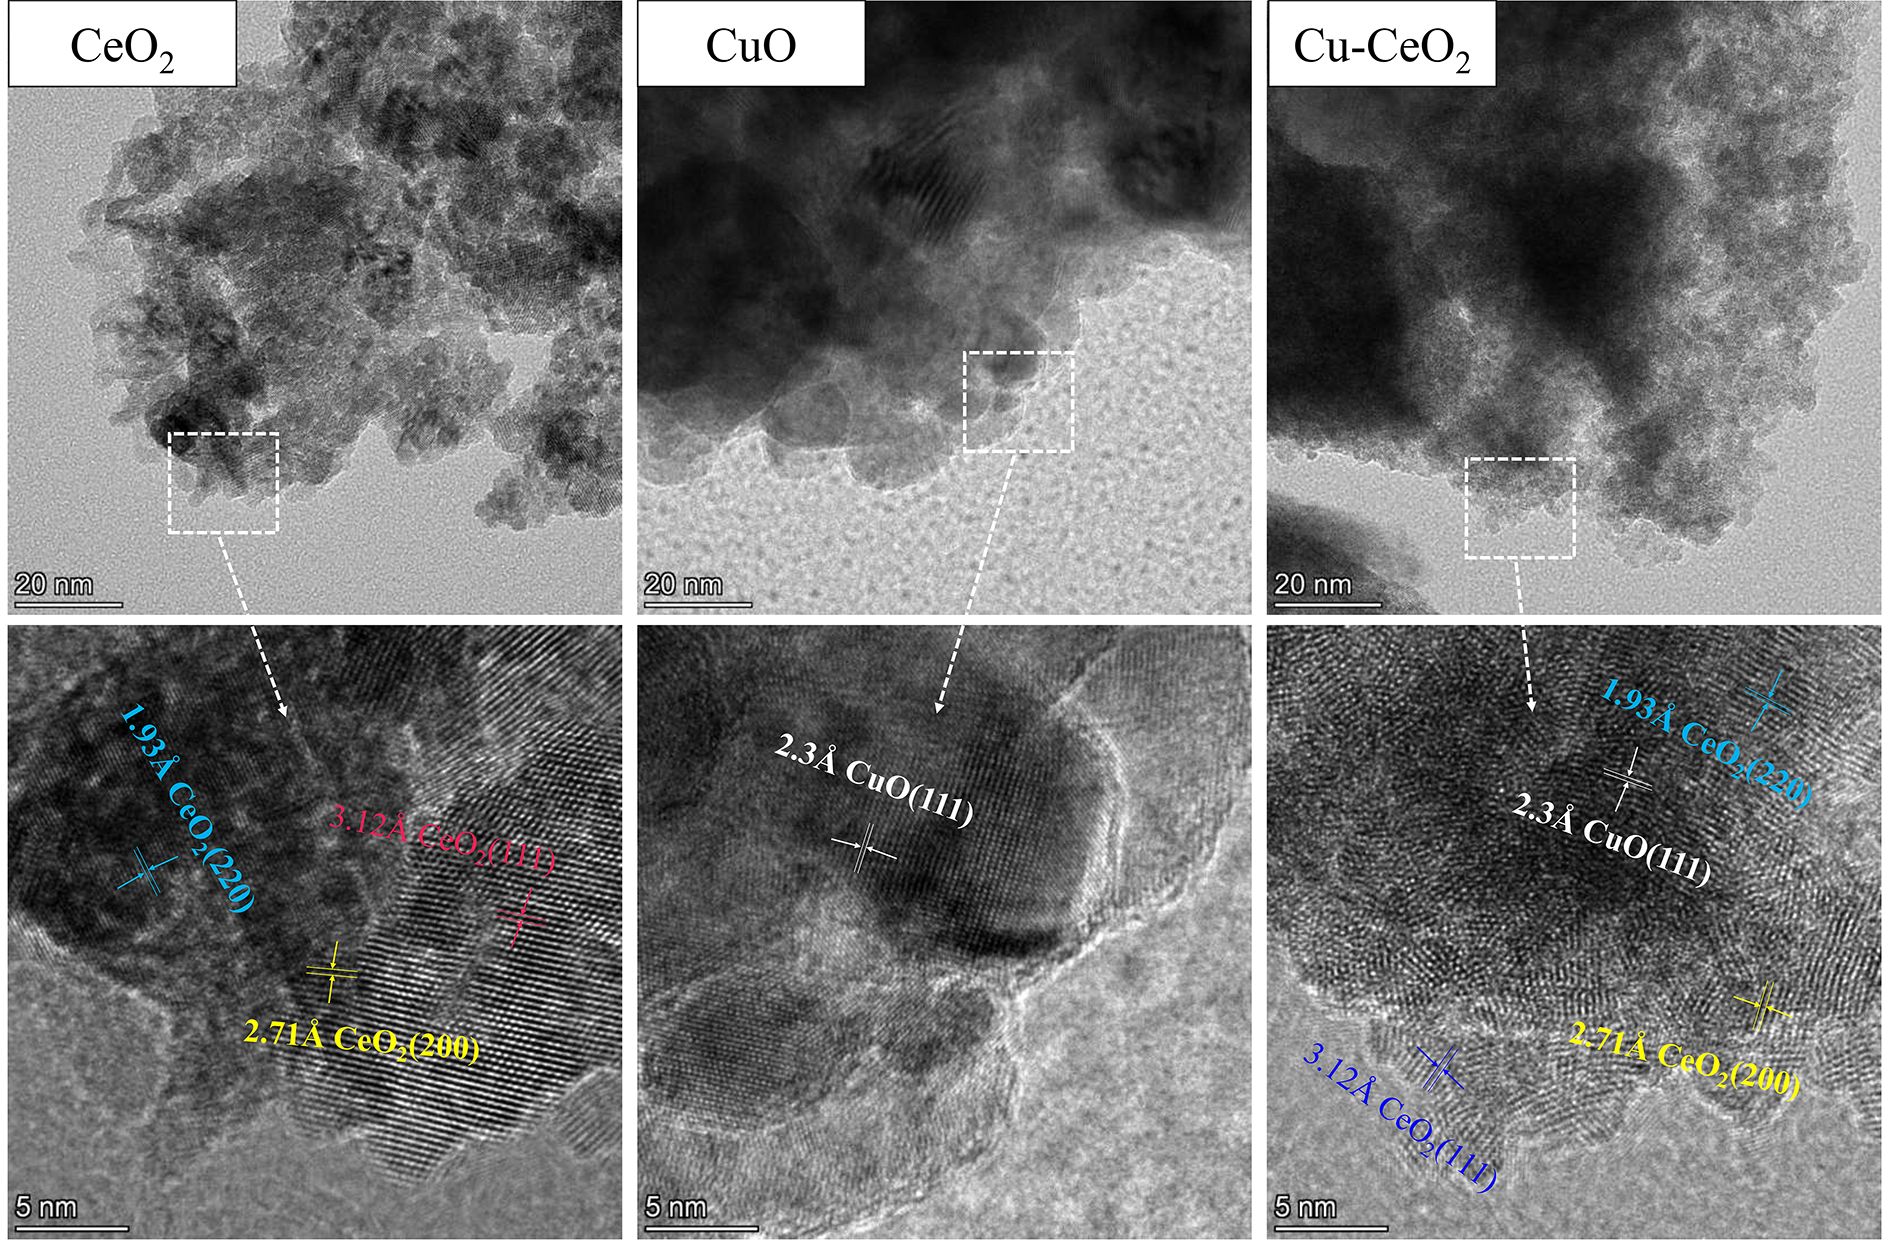
Fig. 7 HRTEM images of the catalysts prepared by the UAP method.
Download figure:
Standard image3.3.2. Crystal features
Table 1 lists the crystal features of CuO, CeO2 and Cu–CeO2 catalysts prepared using the UAP method. The specific surface area of Cu–CeO2 catalyst is close to that of CeO2 but higher than that of CuO, indicating that CeO2 functions as the base structure for Cu doping.
Table 1. Crystal features of the catalysts.
| Sample | Specific surface area (m2 g–1) | Pore volume (cm3 g–1) | Pore diameter (nm) | Cu/Ce molar ratio | Ce3+/(Ce3++Ce4+) ratio | Cu+/(Cu++Cu2+) ratio | Oads content (%) |
|---|---|---|---|---|---|---|---|
| CeO2 | 105.7 | 0.114 | 4.68 | 0.21 | 27 | ||
| CuO | 16.2 | 0.054 | 5.95 | 0.08 | 51 | ||
| Cu–CeO2 | 78.4 | 0.093 | 8.51 | 0.85 | 0.32 | 0.46 | 67 |
The Cu/Ce atomic ratio in the bulk phase of Cu–CeO2 catalyst from inductively coupled plasma optical emission spectroscopy analysis is 0.85, close to the 1 of the Cu/Ce atomic ratio in their nitrates.
The x-ray photoelectron spectra (figure S6) show that Ce3+, Ce4+, Cu+, Cu2+, lattice oxygen (Olatt) and surface oxygen (Oads) are present on the surface of the Cu–CeO2 catalyst. The Cu–CeO2 catalyst has a higher Ce3+/(Ce3++Ce4+) ratio, Cu+/(Cu++Cu2+) ratio and Oads content than CuO and CeO2; these are due to the synergistic effect between Cu+/Cu2+ and Ce3+/Ce4+ [43]. The higher ratios of Ce3+/(Ce3++Ce4+) and Cu+/(Cu++Cu2+) are conducive to oxygen vacancy generation on Cu–CeO2 catalyst, and oxygen vacancies are also the active center for O3 adsorption and decomposition [44]. The higher Oads content is beneficial for catalytic DPM oxidation [45]. Thus, Cu–CeO2 catalyst has better catalytic performance for DPM and HC removals than CuO and CeO2.
Figure 8 describes the x-ray diffraction (XRD) patterns of CeO2, Cu, and Cu–CeO2 catalysts. The characteristic peaks of CeO2 at 2θ of 28.6°, 33.1°, 47.5° and 56.3° are attributed to (111), (200), (220) and (311) planes, respectively [46]. Cu–CeO2 has diffraction peaks mostly similar to CeO2, and the peaks at 28.7°, 33.3°, 47.9° and 56.6° shift slightly to higher 2θ angles than those of CeO2, suggesting that the lattice parameters decrease due to Cu2+ doping into the CeO2 crystal lattice (ion radius Cu2+ < Ce4+) [16, 17]. Thus, Cu is successfully doped into CeO2. In addition, Cu–CeO2 has peaks at 2θ of 35.5° and 38.7° which are associated with CuO (002) and (111), indicating that CuO nanoparticles were generated and not all Cu is doped into the CeO2 lattice. Cu–CeO2 has a polycrystalline structure with components of Cu-doped CeO2 and CuO nanoparticles, resulting in more active sites.
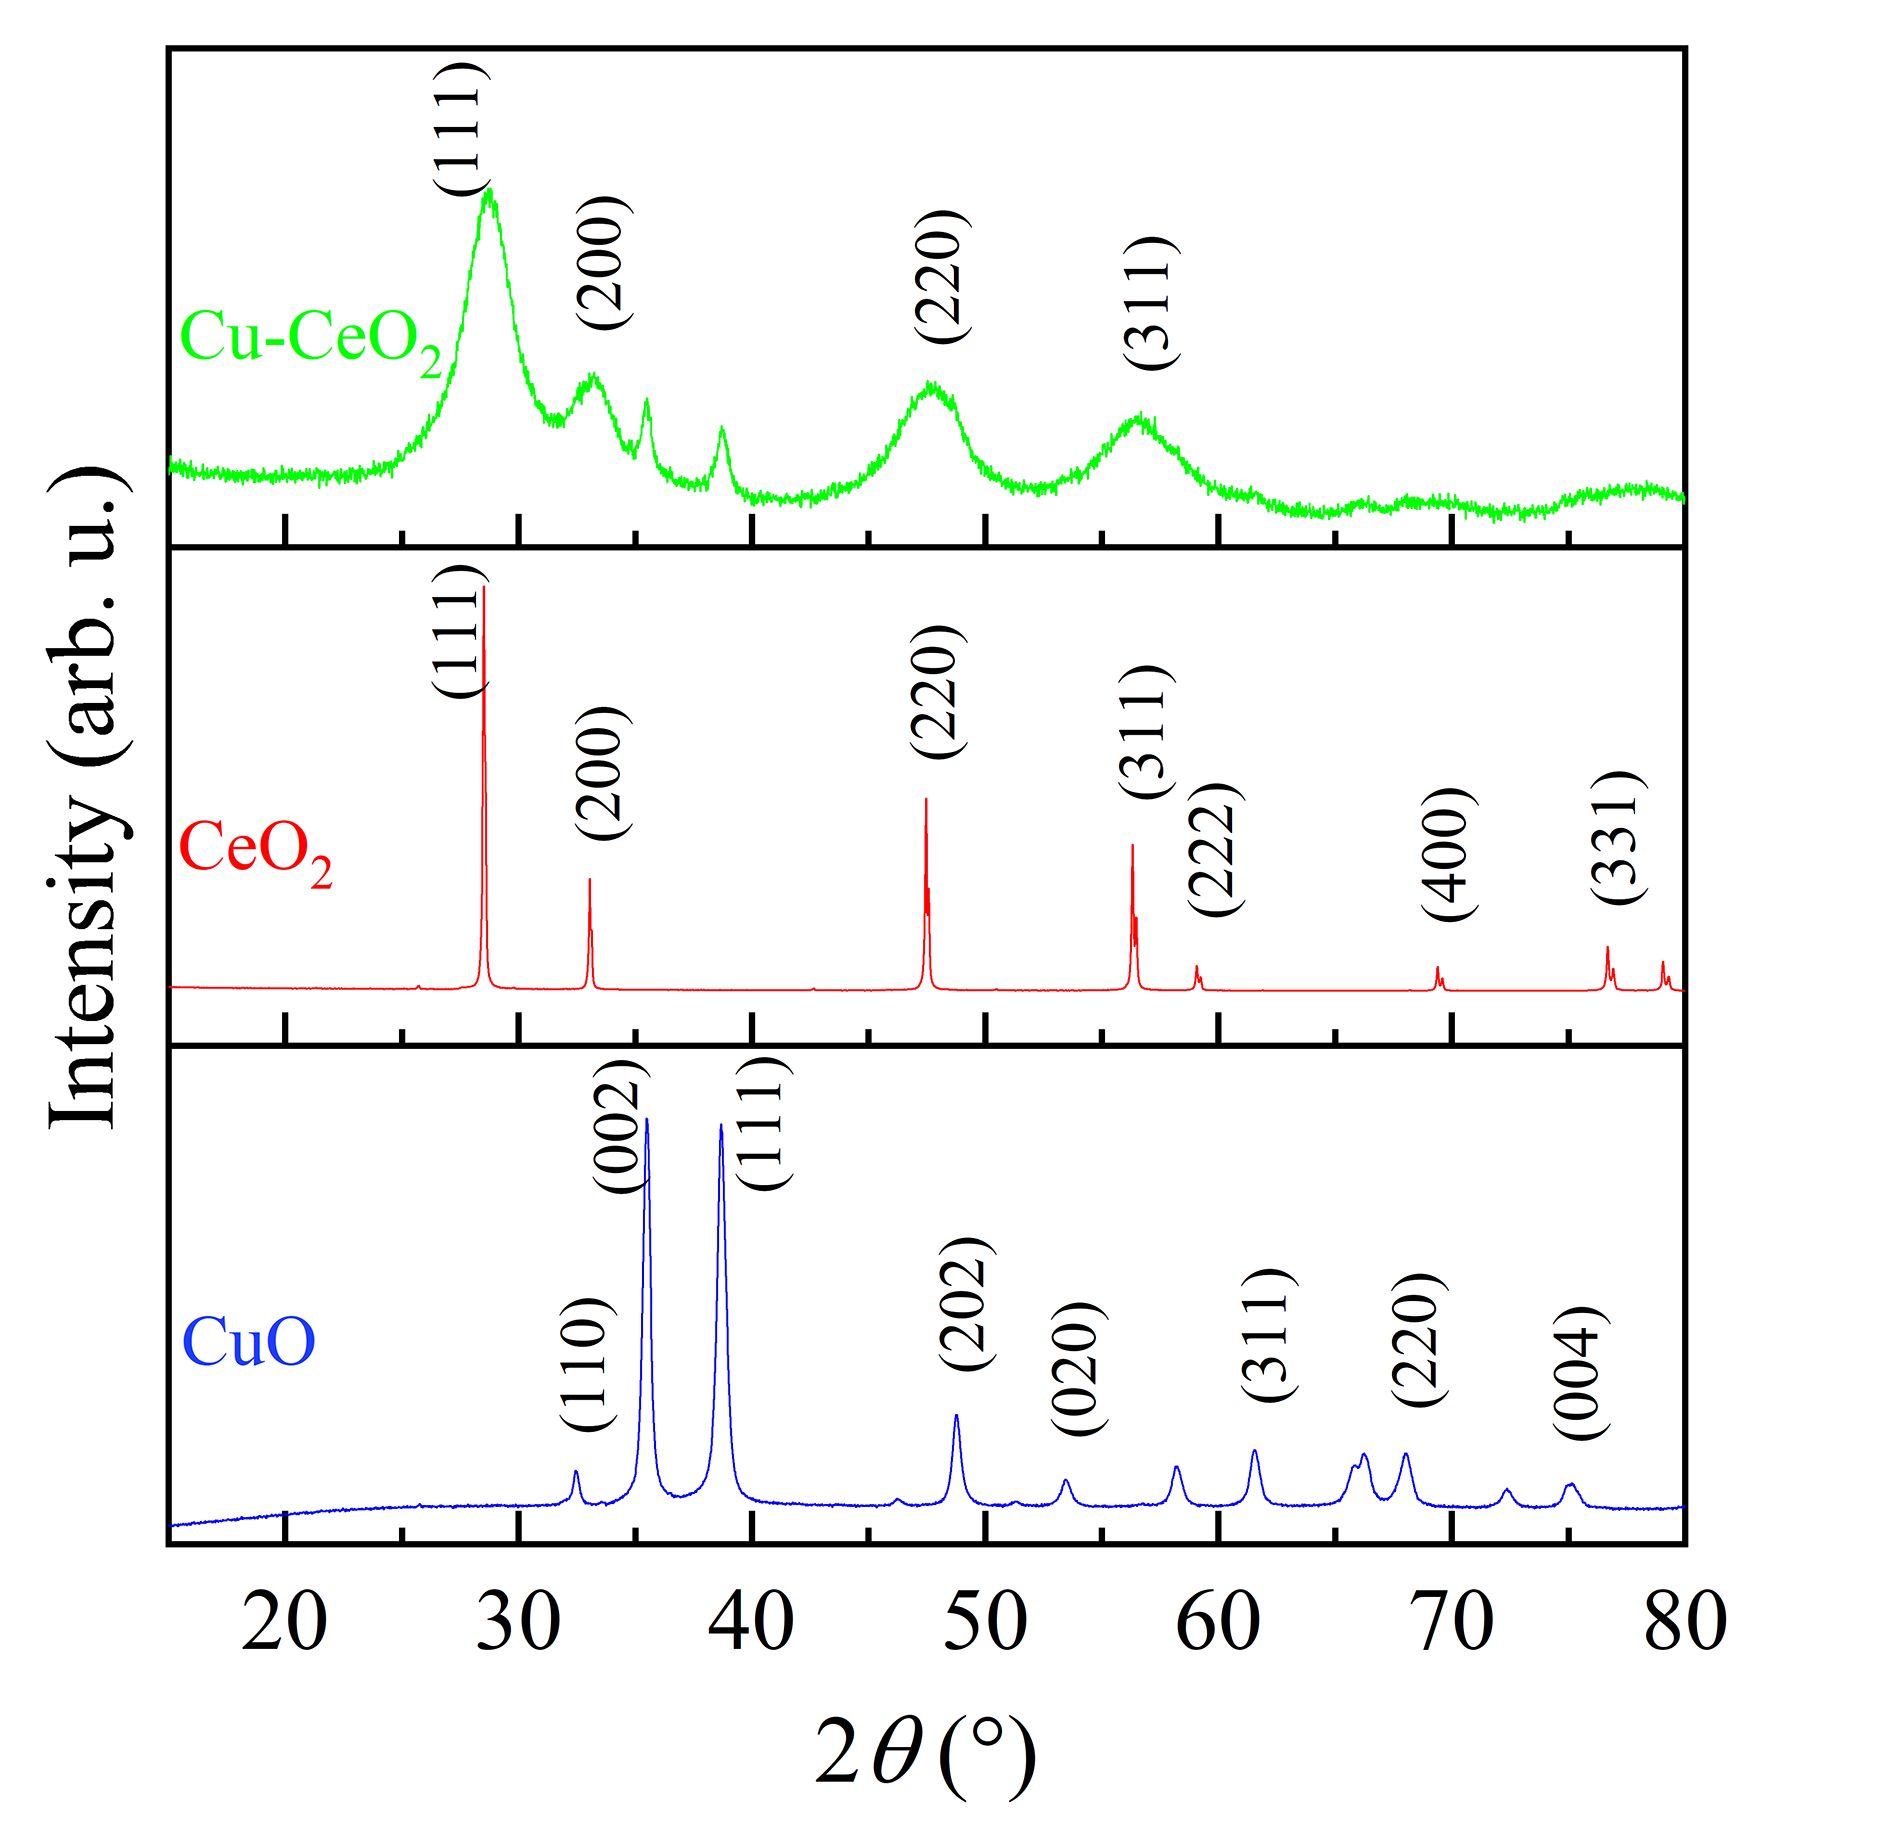
Fig. 8 XRD patterns of the catalysts.
Download figure:
Standard image3.4. Characterization of DPM oxidation mechanism
Operando DRIFTS-MS was employed to investigate surface functional groups and gaseous products during DPM oxidation at 200 °C by mixing DPM with no catalyst (no cat./DPM), CuO (CuO/DPM), CeO2 (CeO2/DPM) and Cu–CeO2 (Cu–CeO2/DPM) without and with plasma.
During DPM oxidation without catalyst (figure 9(a)), no obvious spectral signal was found in the first 60 min without plasma, and some peaks appeared in the next 60 min with plasma. The peaks at about 3150, 2340, 1750, 1390 and 1050 cm−1 are ascribable to ν(O–H) in hydroxyl groups, ν(CO2), ν(C=O) in carbonyls group, νs (COO) and ν(C–O) in carboxylic acids and ethers, respectively [46, 47]. The adsorbed CO2 can be gasified during plasma DPM oxidation, so its peak is negative. The heights of all the peaks increase with increasing discharge time, indicating accumulation of the surface species. The peak height variations of typical oxygen-containing groups C=O at ~1750 cm−1 and C–O at 1050 cm−1 are plotted in figure 10(a). The peak heights of surface carbon oxides (C=O and C‒O) are near zero without plasma (1‒60 min), indicating that the surface oxygen groups on DPM are little changed without plasma. With plasma (61‒120 min), they increase along with time, and the CO2 MS signal intensity also becomes higher (figure S7), suggesting that the DPM is easily oxidized to surface carbon oxides and CO2 [26, 48]. The burn-off of the nano-sized DPM particles results in a decrease in DPM particle number [49] and formation of more CO2.
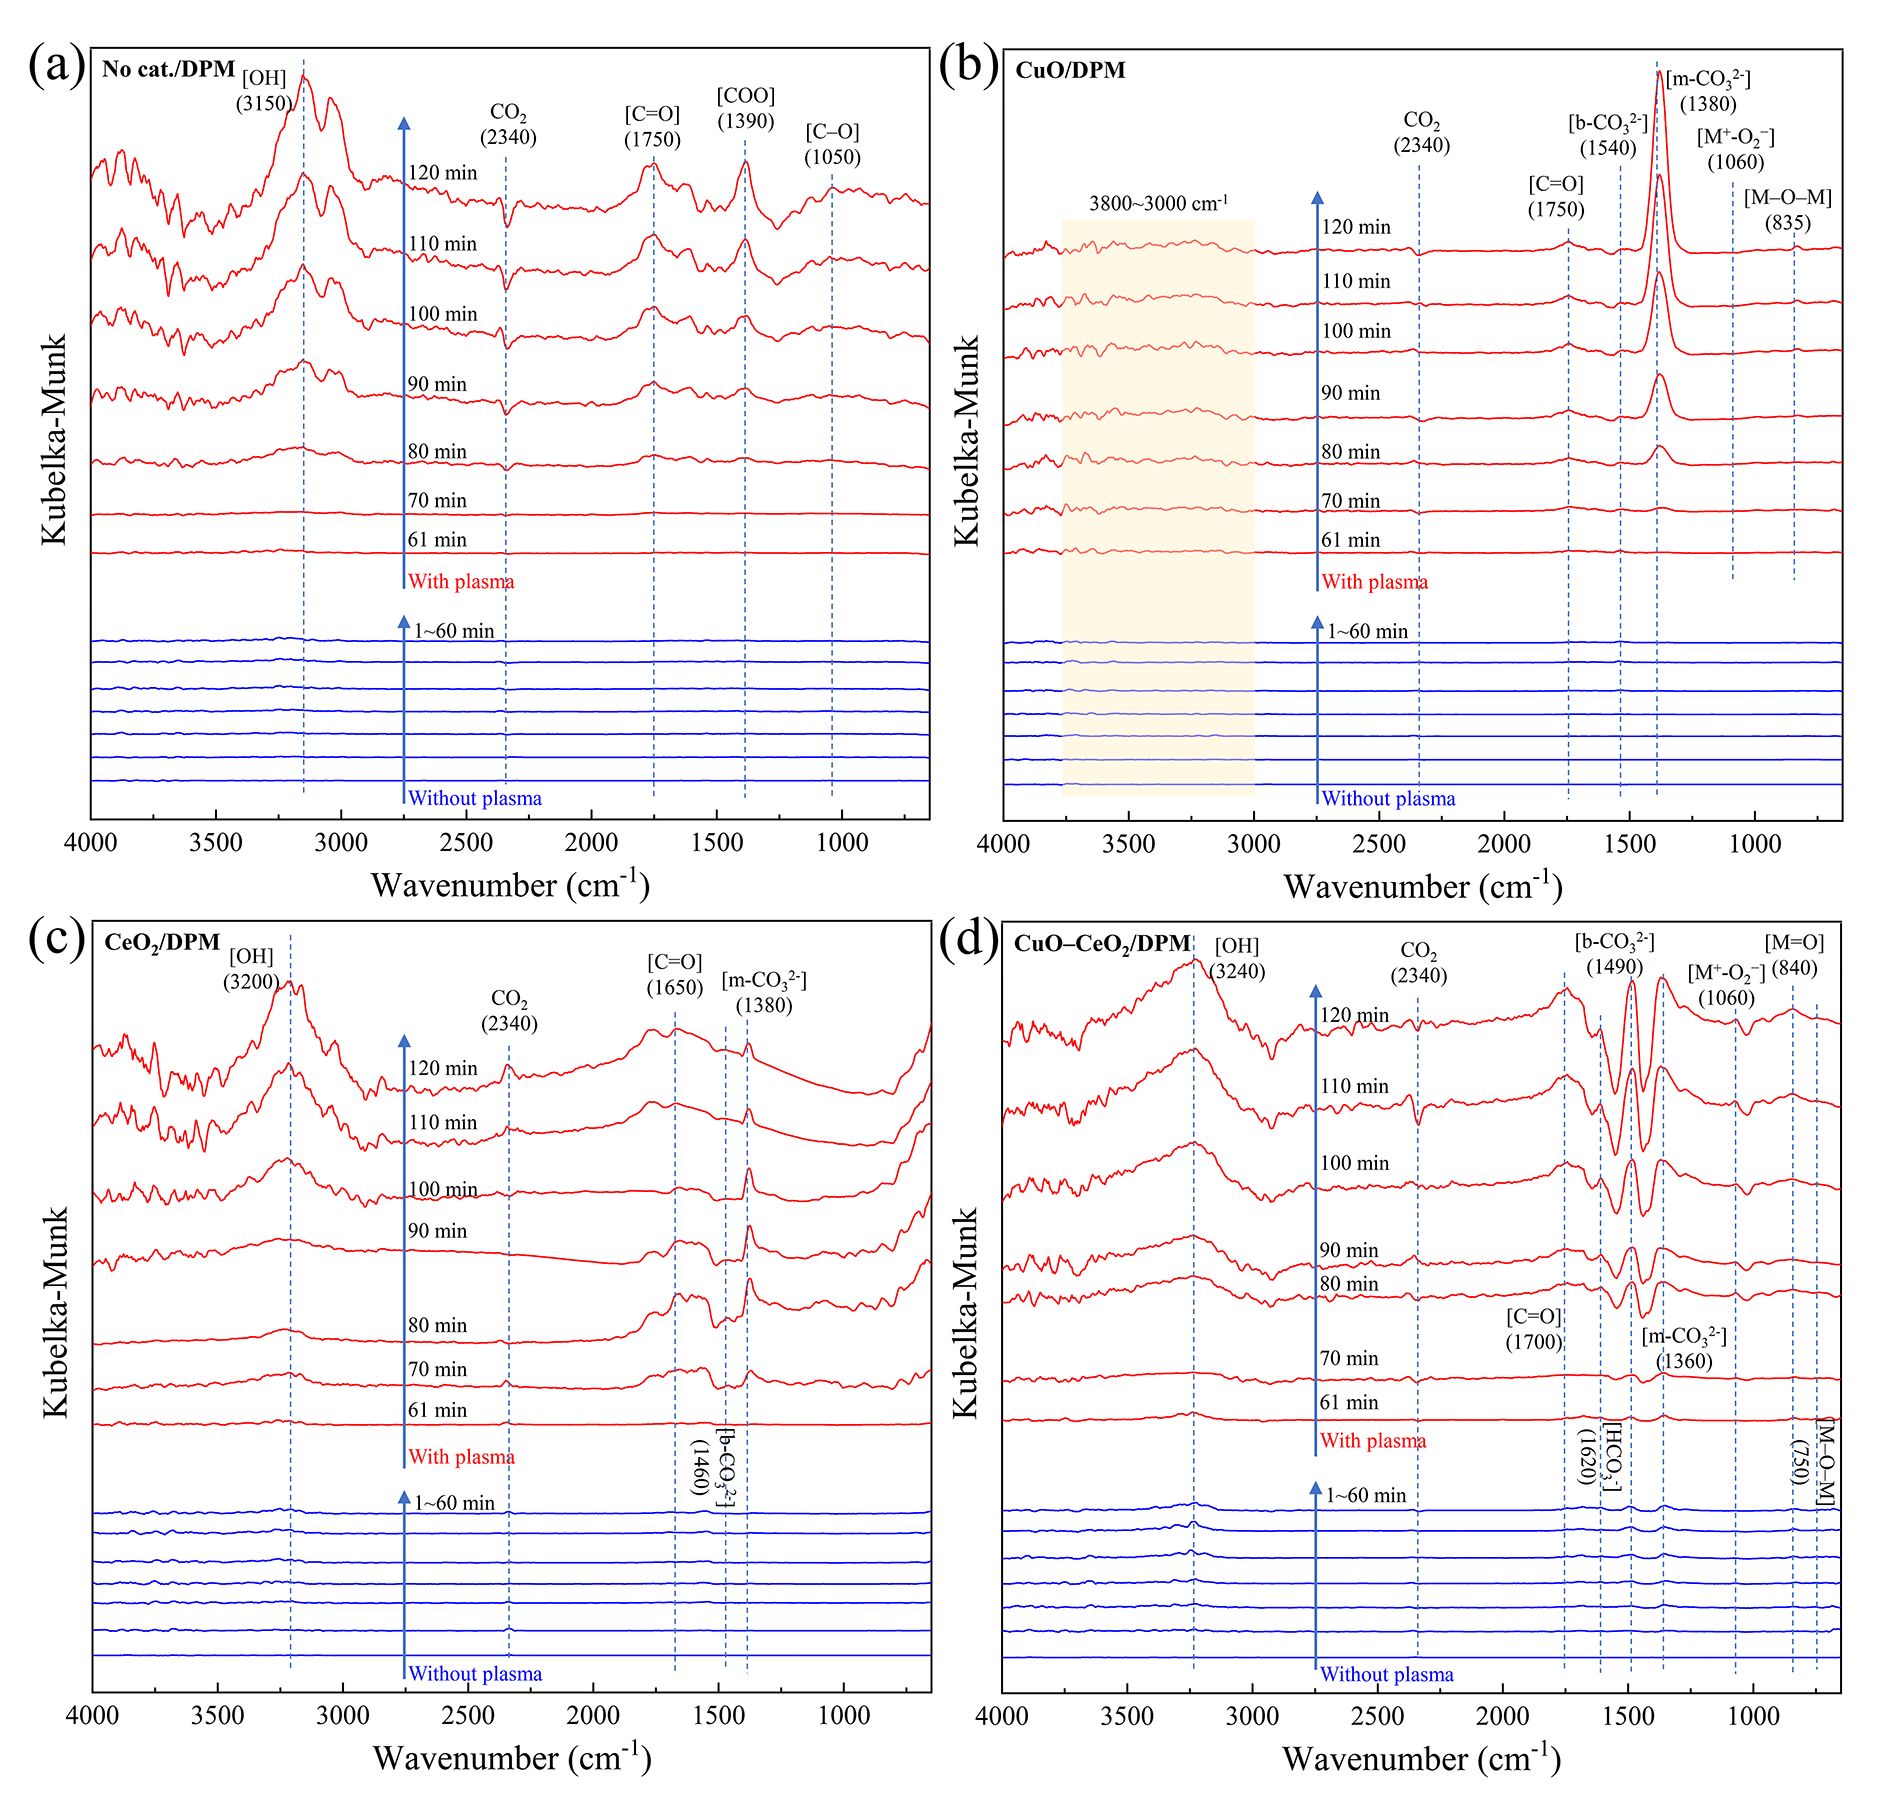
Fig. 9 Operando DRIFTS spectra during DPM oxidation without plasma (1‒60 min) and with plasma (61‒120 min). DPM was mixed (a) without catalyst and with (b) CuO, (c) CeO2 and (d) Cu–CeO2. Experimental conditions: KBr/catalyst/DPM weight ratio 100/10/1; temperature 200 °C; discharge power 0 W (without plasma) or 6 mW (with plasma).
Download figure:
Standard image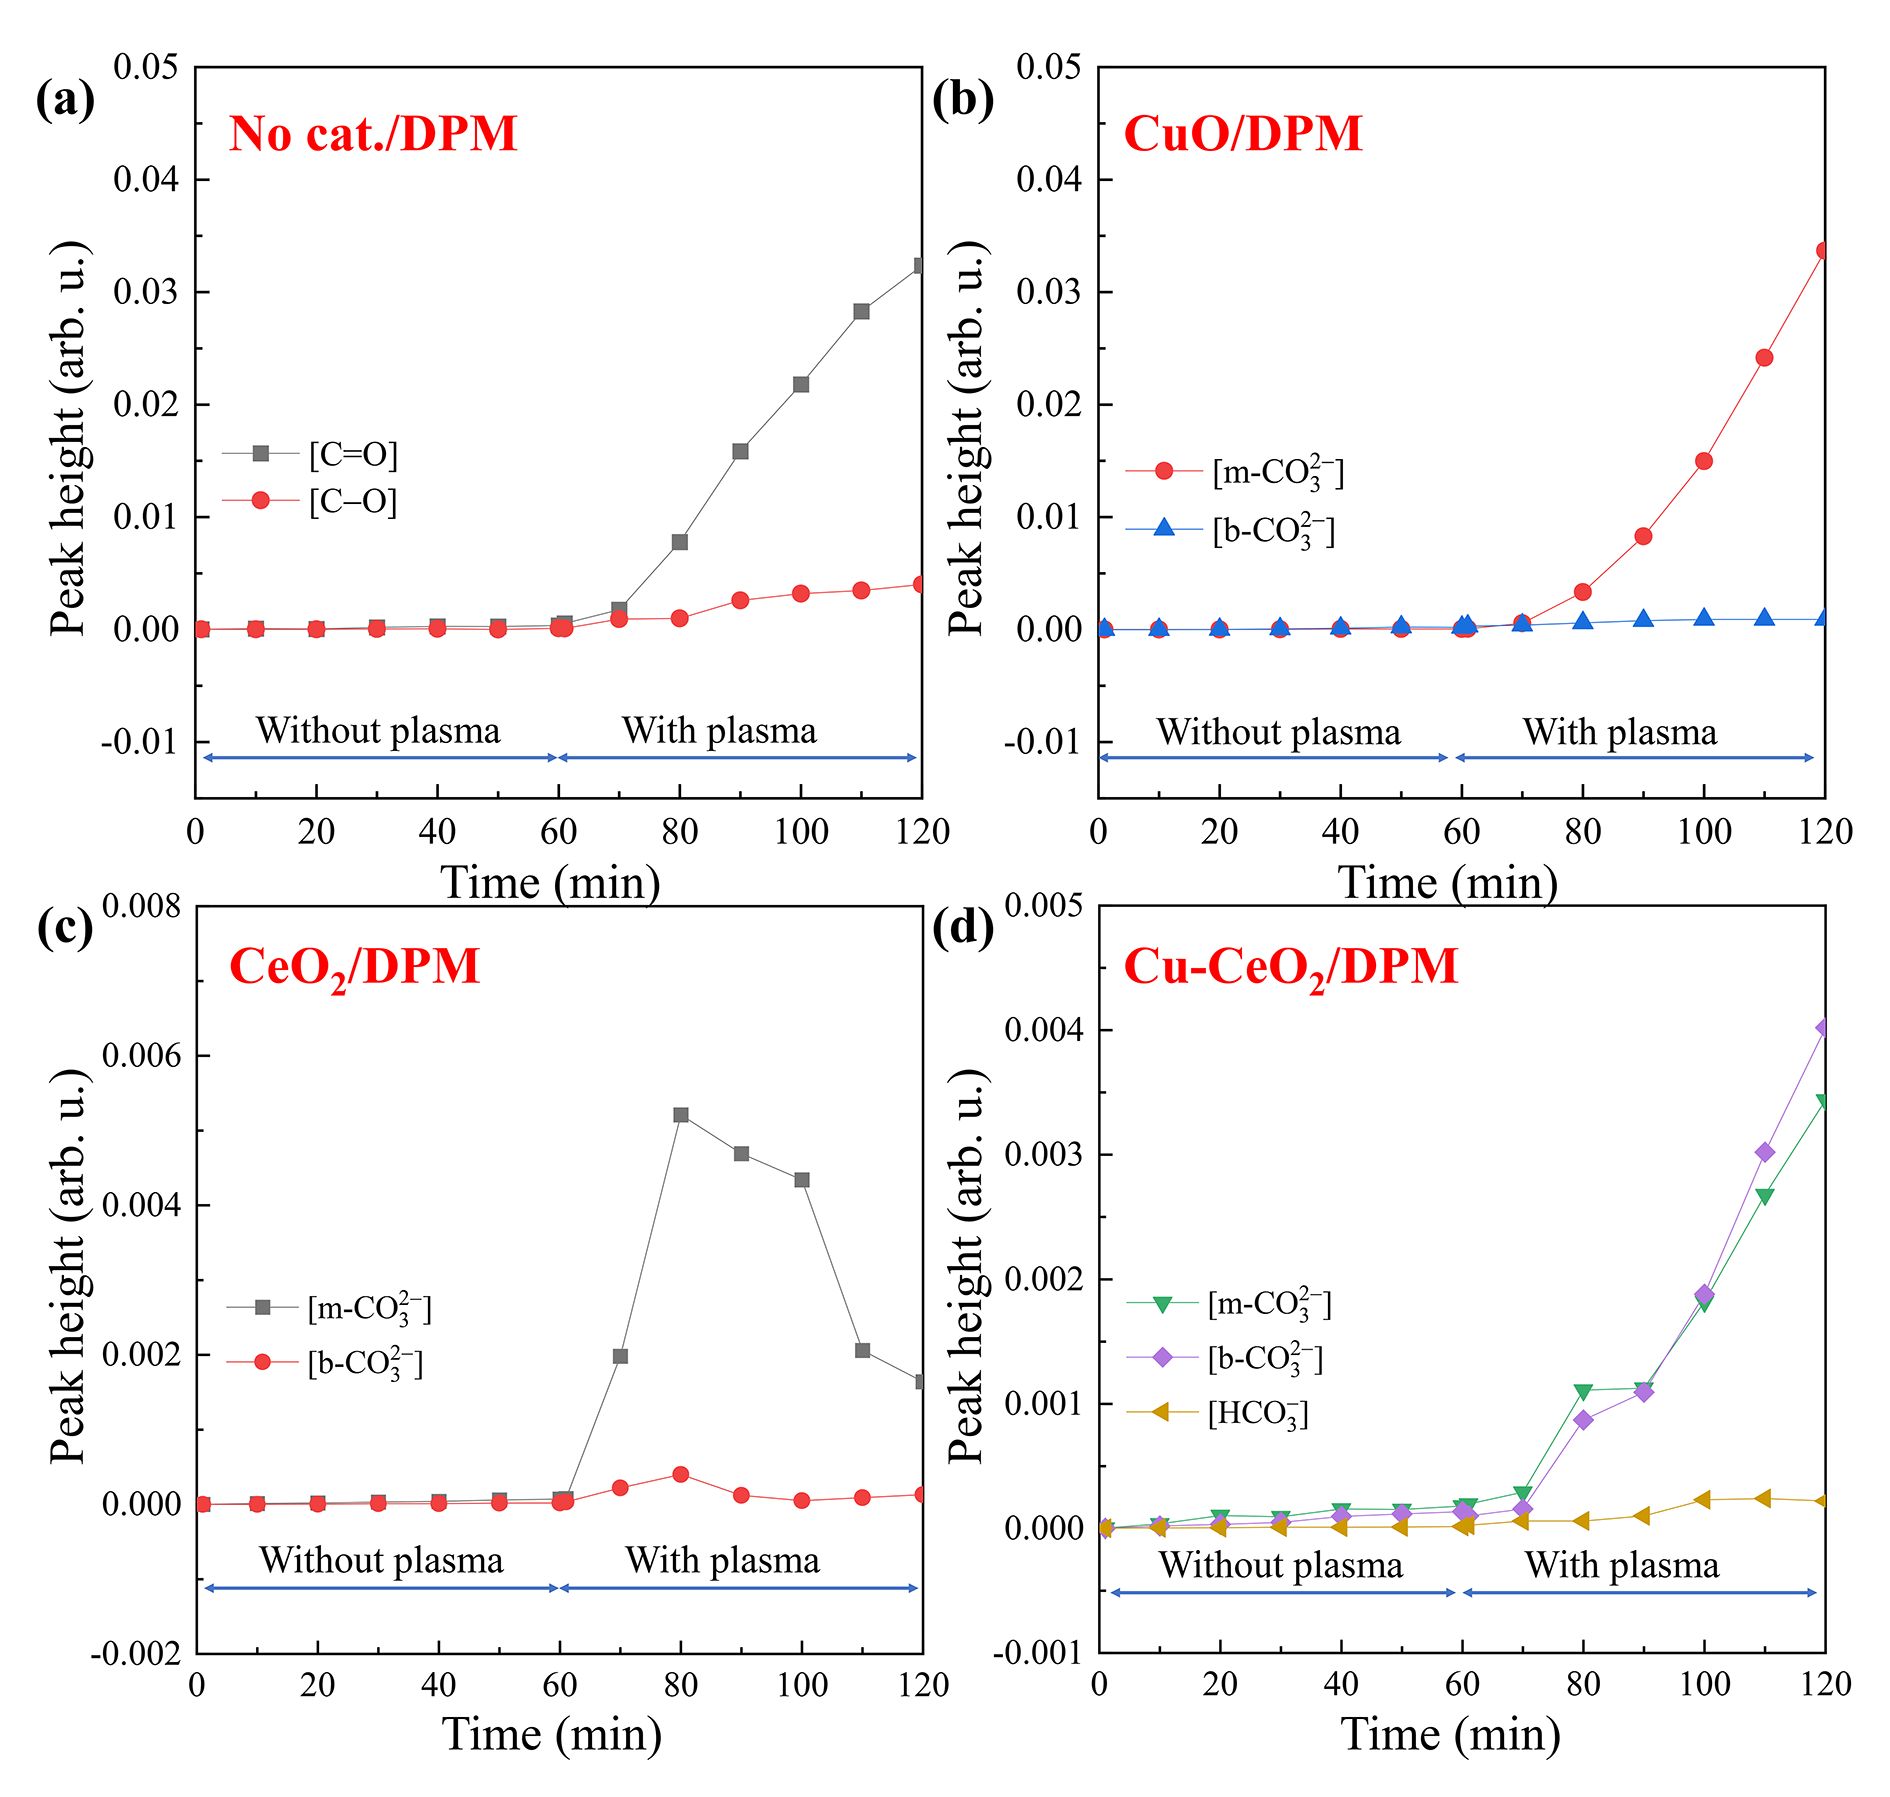
Fig. 10 Peak heights of different surface species (data from figure 9) as functions of reaction time.
Download figure:
Standard imageDuring DPM oxidation on CuO (figure 9(b)), no strong peaks emerged in the first 60 min without plasma, indicating that little DPM is oxidized. With plasma in the next 60 min several peaks appeared. The peaks at 1540, 1380, 1060 and 835 cm−1 are assigned to bidentate carbonate (b- ), monodentate carbonate (m-
 ), adsorbed oxygen (M+–
 ) (M denotes Cu) and bridging oxygen (M–O–M), respectively [50–52]. The peak heights of M–O–M and M+–
 increased with discharge time, indicating that active oxygen from plasma could be adsorbed on CuO and transformed into M–O–M and M+–
 . The peak of m-
 is extremely prominent when with plasma (61‒120 min), but there are no strong peaks within 3800‒3000 cm−1 (assigned to OH), indicating that hydroxyl and carboxyl groups could be converted into m-
 . The peak heights of carbonates (m-
 and b-
 ) are plotted in figure 10(b) as functions of reaction time. The m-
 peak height increases with time, meaning that plasma can promote [m-
 ] accumulation, but has no effect on b-
 accumulation on CuO. The main surface oxygen complex (SOC) on CuO during DPM plasma oxidation is m-
 .
.
During DPM oxidation on CeO2 (figure 9(c)) peaks at 3200, 2340, 1650, 1460 and 1380 cm−1 are found which, respectively, correspond to OH, CO2, C=O, b- and m-
 species [53]. The peak heights of two carbonates (m-
 and b-
 ) as functions of reaction time are plotted in figure 10(c). Without plasma (1–60 min), the heights of the two peaks (m-
 and b-
 ) did not change, indicating that no DPM is oxidized. With plasma (61‒120 min), more carbonates are generated and subsequently decomposed to gaseous CO2 (figure 10(c)) as their peak heights increase first and then decrease.
For DPM oxidation on Cu–CeO2, peaks were found at 3240, 2340, 1700, 1620, 1490, 1360, 1060, 840 and 750 cm−1 (figure 9(d)), which respectively correspond to OH, CO2, C=O,  , b-
, b- , m-
, m- , M+‒
, M+‒ (M denotes Cu or Ce), terminal oxygen (M=O) and M‒O‒M [53–55]. Without plasma (1‒60 min), the peak patterns gradually appear, indicating that the activity of Cu–CeO2 is superior to CuO and CeO2, but little DPM was oxidized as the peaks were weak. With plasma (61‒120 min), the increases in the heights of M=O and M‒O‒M peaks are due to the increasingly stronger peak of M+‒
 because more active oxygen could be generated with plasma and adsorbed by metal oxides. The peak heights of SOCs (m-
 , b-
, b- and
and  ) raised to a certain level and were maintained (figure 10(d)), indicating that their generation and consumption were balanced. The MS analysis result (figure S7) also indicates that the SOCs on Cu–CeO2 can easily convert to gaseous CO2. This fact implies that HC
 and b-
 are easier to decompose to gaseous CO2.
The mechanism of DPM oxidation enhanced by plasma and Cu–CeO2 is illustrated in figure 11. The main surface intermediates for DPM oxidation are b- and m-
 . Although CuO and CeO2 catalysts can promote DPM plasma oxidation, the formation of surface m-
 carbonate (which is difficult to convert to gaseous CO2) inhibits the catalytic effect. Cu-doped CeO2 catalyst can greatly improve DPM oxidation because the surface reactive oxygen species [O] (M+‒
 and M=O) can participate in DPM oxidation and enhance gasification of SOCs to CO2.
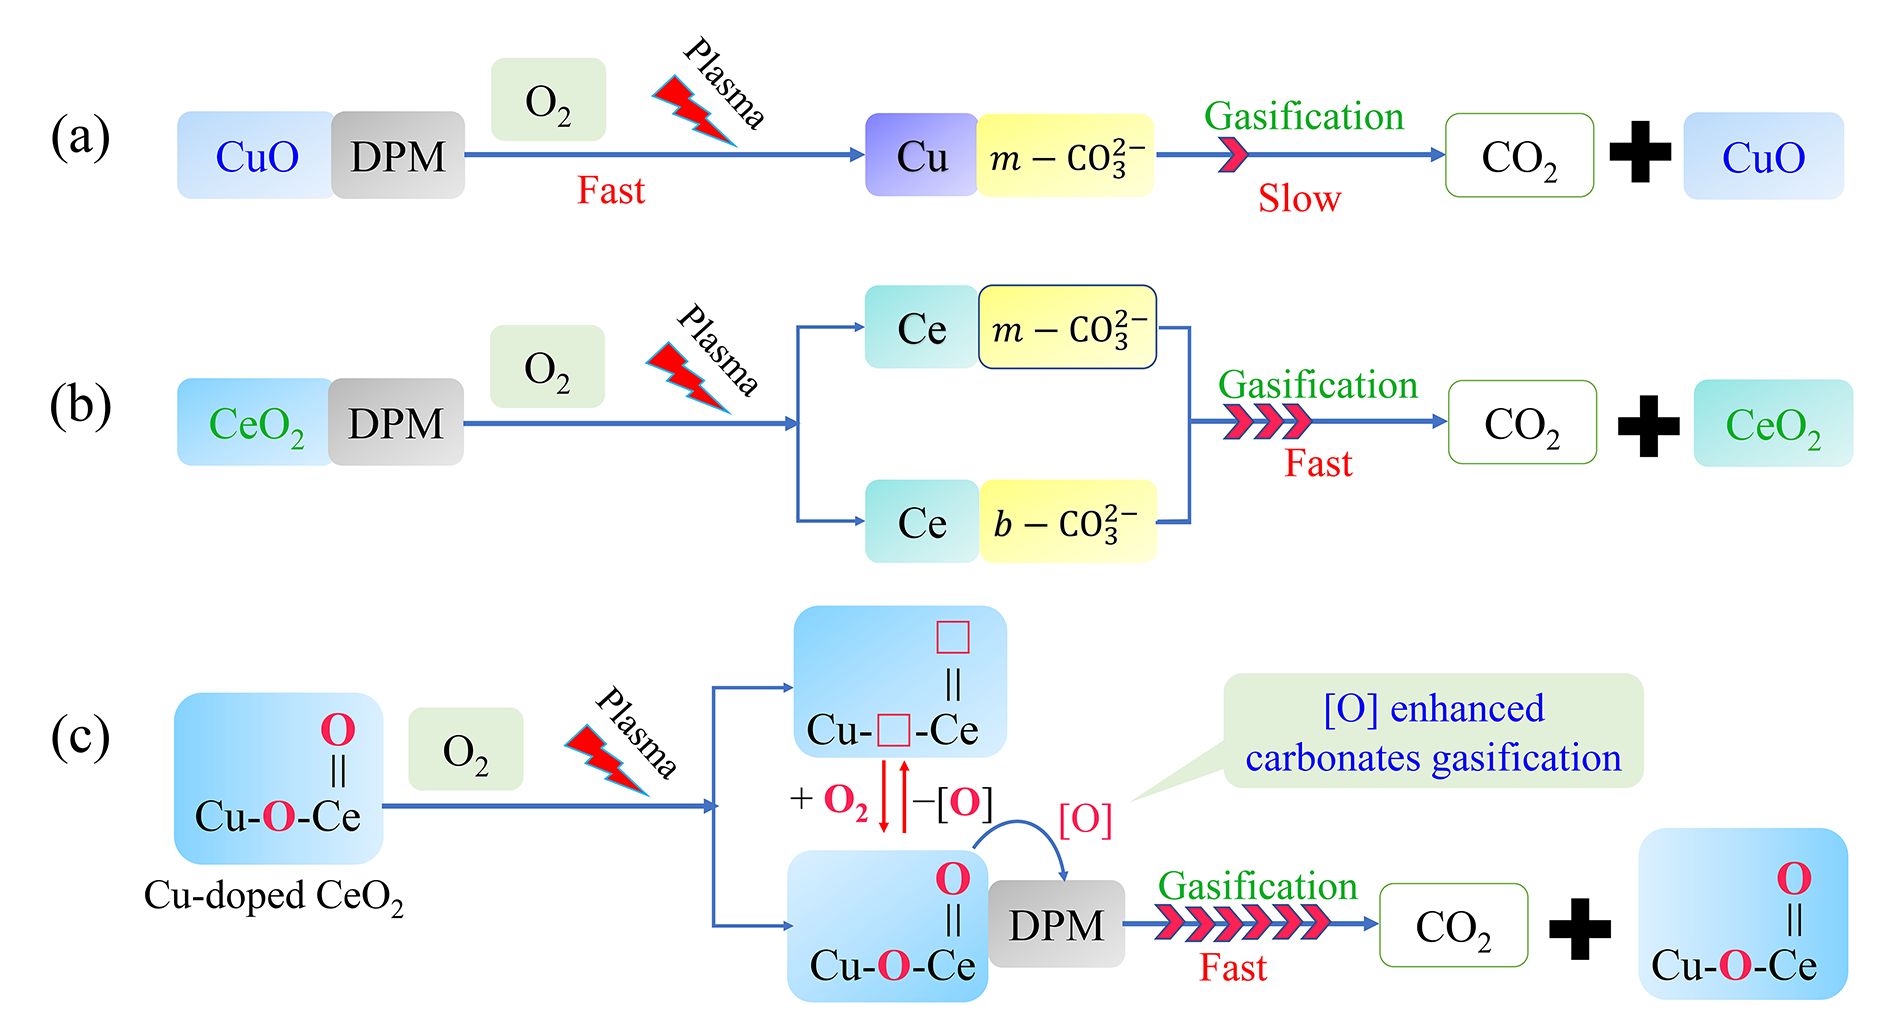
Fig. 11 Mechanism of plasma-assisted DPM catalytic oxidation on Cu–CeO2 catalysts. □ denotes oxygen vacancy.
Download figure:
Standard image4. Conclusion
In conclusion, a DBD reactor with Cu–CeO2/Al2O3 catalyst can efficiently promote removals of DPM and HC. Removal of 90% DPM and 92% of HC were achieved over Cu–CeO2/Al2O3 coupled with DBD plasma at an ED of 9.8 J L–1 and a temperature of 200 °C, and stable DPM and HC removal performances could be maintained for 10 h. DPM and HC removals on Cu–CeO2/Al2O3 are higher than those on CuO/Al2O3 or CeO2/Al2O3 due to more Oads and oxygen vacancies being generated by Cu doping into CeO2.
With plasma, O3 can promote oxidation of DPM and HC by decomposition to active oxygen species and oxygen vacancies; CuO can promote the formation of more M+– and M–O–M species that react with DPM to rapidly form m-
 ; m-
; m- and b-
 are generated on CeO2 and slowly gasify to gaseous CO2; Cu-doped CeO2 catalyst can greatly improve DPM oxidation because the surface reactive oxygen species [O] (M+‒
 and M=O) can participate in DPM oxidation and enhance carbonate gasification to CO2.
Supplementary data (4.92 MB, PDF)