
Abstract
AlMnFeCuNi high entropy alloy (HEA) coatings were electrodeposited onto mild steel substrate with and without incorporation of carbon nano tubes (CNT). This paper focused on the morphology, hardness, wear and corrosion behaviour for as deposited HEA and HEA-CNT coatings. Both the coatings constituted simple solid solution with face-centered cubic (FCC) structure. The addition of carbon nano tubes in the HEA coatings as revealed by scanning electron microscopy showed more smaller granules and compact morphology with least coating thickness value (5 ± 0.35 μm). Enhanced Anti-wear performance results in higher hardness and lower coefficient of friction. The presence of CNTs resulted improvised corrosion resistant properties in 3.5% NaCl corrosive media. The formation of more protective oxides such as Alox+3, Mnox+2 and Feox+3 on passive oxide layer in HEA-CNT coatings acted as a barrier, protected it from corrosion.
Export citation and abstract BibTeX RIS

Original content from this work may be used under the terms of the Creative Commons Attribution 4.0 licence. Any further distribution of this work must maintain attribution to the author(s) and the title of the work, journal citation and DOI.
1. Introduction
High entropy alloys (HEA), in advanced research occupies the place of new metallic alloys class which steers away from properties of the traditional alloy design [1]. According to conventional theory, the alloys mainly constitute of one main principal elements and rest are present in small amounts, which differs the HEAs by having multi principal elements in equiatomic or near equiatomic ratios from five to thirteen major elements [2]. Although metallurgical theory reveals the demonstration of complex phases and formation of intermetallic compounds, HEAs fails to follow this theory at some extent by forming simple solid solution phases and single crystal structure such as BCC, FCC, HCP etc [2]. The structure and property of these alloys are defined by fore core effect theory namely: high entropy effect, severe lattice distortion, sluggish diffusion and cocktail effect [2]. Several properties such as remarkable corrosive resistant, high strength, high hardness and tribological properties categorize these HEAs as structural and functional materials [3]. Also, HEAs can uphold their properties at higher temperatures [4].
Many techniques are used for the deposition of high entropy alloys thin films and coatings for various property enhancement which are used as functional materials. One of the deposition techniques namely electrodeposition, demonstrates number of advantages which simplifies the equipment design, shortens the synthesis time, reduces energy consumption [5]. Few works have been carried out until now which shows the electrochemical synthesis. CoCrFeMnNi [6], FeCoNiCuZn, AlCrFeMnNi, AlCrCuFeMnNi [7], are few HEAs electrodeposited to enhance corrosion behavior and study micro structural relations. FeCoNiMn HEA incorporation with Tm, Bi, Mg-Gd were used to prepare HEA thin films through electrodeposition route on the mild steel substrate to study magnetic, thermoelectric and fuel cell applications [8]. Pulse electrodeposition was employed on FeCoNiMnW to act as a bi-functional catalyst [9] by studying the chemical states of sample elements.
To enhance the corrosive resistant properties, many carbonaceous elements or any foreign elements can be incorporated such as graphene oxide, carbon nano tubes etc. Aliyu et al [10, 11] studied electrodeposition route on various HEA compositions for enhanced corrosion resistance properties. Sujata et al investigated the optimum carbon nano tubes incorporation in FeCoCrNiCu, FeCrMnNiCo, FeCuMnNiCo HEAs to improvise corrosive resistance properties of mild steel by studying surface oxide behaviour [12–14]. Freitas et al [15] deposited CoFeNiMoW high entropy alloy by direct galvanostatic electrodeposition in aqueous medium on brass plates. The HEA thin film formation was confirmed by EDS, XRD and M¨ossbauer spectroscopy concluding a simple and cost-effective technique. Potentiostatic electrodeposition was carried out in organic media to obtain CoCrFeMnNi HEA. A more homogeneous coating with better corrosion resistance was obtained at −2.1 V as compared to −2.5 V [16]. Yoosefan et al [6] deposited CoCrFeMnNi by electrodeposition at various potentials (4, 5 and 6 V) and the optimization showed morphological and chemical homogeneity at 5 V with lowest corrosion rate.
In this present research work electrodeposition of AlMnFeCuNi on mild steel (MS) substrate with incorporation of carbon nano tubes (CNT) were studied. The bath composition used for electrodeposition is shown in table 1. Corrosion studies, surface oxide chemistry and tribological performance was studied on as deposited AlMnFeCuNi HEA (without CNT) and AlMnFeCuNi HEA-CNT coatings (with CNT). The incorporation of Aluminium (p-block element) together with transition metals (d block elements) shows the novelty of this work in idea of making the substrate more corrosive resistance with simple electrodeposition setup.
Table 1. Bath condition used for electrodeposition of AlMnFeCuNi HEA and AlMnFeCuNi HEA-CNT coatings.
| Sample | Bath composition | Concentration (g l–1) | Condition |
|---|---|---|---|
| AlMnFeCuNi | AlCl3 6H2O | 24.14 | Current density: 55 mA cm−2 |
| MnCl2 6H2O | 5.96 | Temperature: 30 ± 2 °C | |
| FeCl2 4H2O | 7.95 | Deposition Time :20 min | |
| CuCl2 2H2O | 4.26 | pH:1.5, | |
| NiCl2 6H2O | 16.64 | Continuous stirring speed: 350 rpm | |
| AlMnFeCuNi-CNT | HCNT1 | 12.5 mg l−1 | |
| Carbon Nano Tubes | HCNT2 | 30 mg l−1 |
2. Experimental procedure
2.1. Electrodeposition of HEAs on mild steel substrate
Mild steel substrate of size 20 mm × 20 mm as cathode was electrodeposited using platinum of same dimension as anode. The substrate was abraded using SiC abrasive papers of 180, 220, 600, 800, 1000, 1200, 1500, 2000 grit size to attain smooth surface, followed by degreasing in acetone by ultrasonication for 20 min. The surface activation of the samples was carried out using dilute HCl. Degreasing was followed by cleaning with distilled water before electrodeposition. Before electrodeposition pH of the electrolytic bath was maintained at 1.5 using HCl. In this experiment the AlMnFeCuNi, AlMnFeCuNi-CNT high entropy alloy coatings were electrodeposited at the constant pH of 1.5. Table 1 shows the bath composition and the parameters used during electrodeposition. Table 2 shows the additives used for enhancing the morphology and homogeneity of the coatings. The electrolytic bath solution was prepared using chloride salts by using deionised water. Figure 1 shows the schematic diagram of sample preparation through electrodeposition with CNT incorporation. A detailed specimen processing method is described in figure 2.
Table 2. Concentration and properties of additives used for electrodeposition.
| Additives | Concentration (gl−1) | Properties |
|---|---|---|
| Gelatin | 7.0 | • Acts as levelling agent and grain refiners. |
| • Modifies electrochemical reactions and the crystal growth of | ||
| • electroplating by its preferred adsorption on the surface protrusions. | ||
| Ammonium chloride | 119.8 | • Supporting electrolyte to increase conductivity and pH buffer. |
| • Refine grain size. | ||
| • Increase the cathodic current efficiency. | ||
| Potassium chloride | 120 | • Enhance conductivity and improve coating morphology. |
| Boric acid | 49.4 | • Acts as buffer and enhance surface adsorption of the ions. |
| Sulphanilic acid | 5.2 | • Grain refiners morphology. |
| • Spherical or fine-grained structures. | ||
| • Improves coating uniformity. | ||
| Ascorbic acid | 5.0 | • Enhance coating compactness and uniform coatings. |
| • Act as inhibitors to electrodeposits. | ||
| Sodium lauryl sulphate | 4.0 | • Ease the incorporation of metallic ions into the coatings. |
| • Provide hydrophobicity to the coatings. | ||
| Formic acid | 0.5 (ml) | • Increases the corrosion resistance of electrodeposition. |
| • Enhance deposition efficiency. | ||
| • Increase the conductivity of the bath solution. |
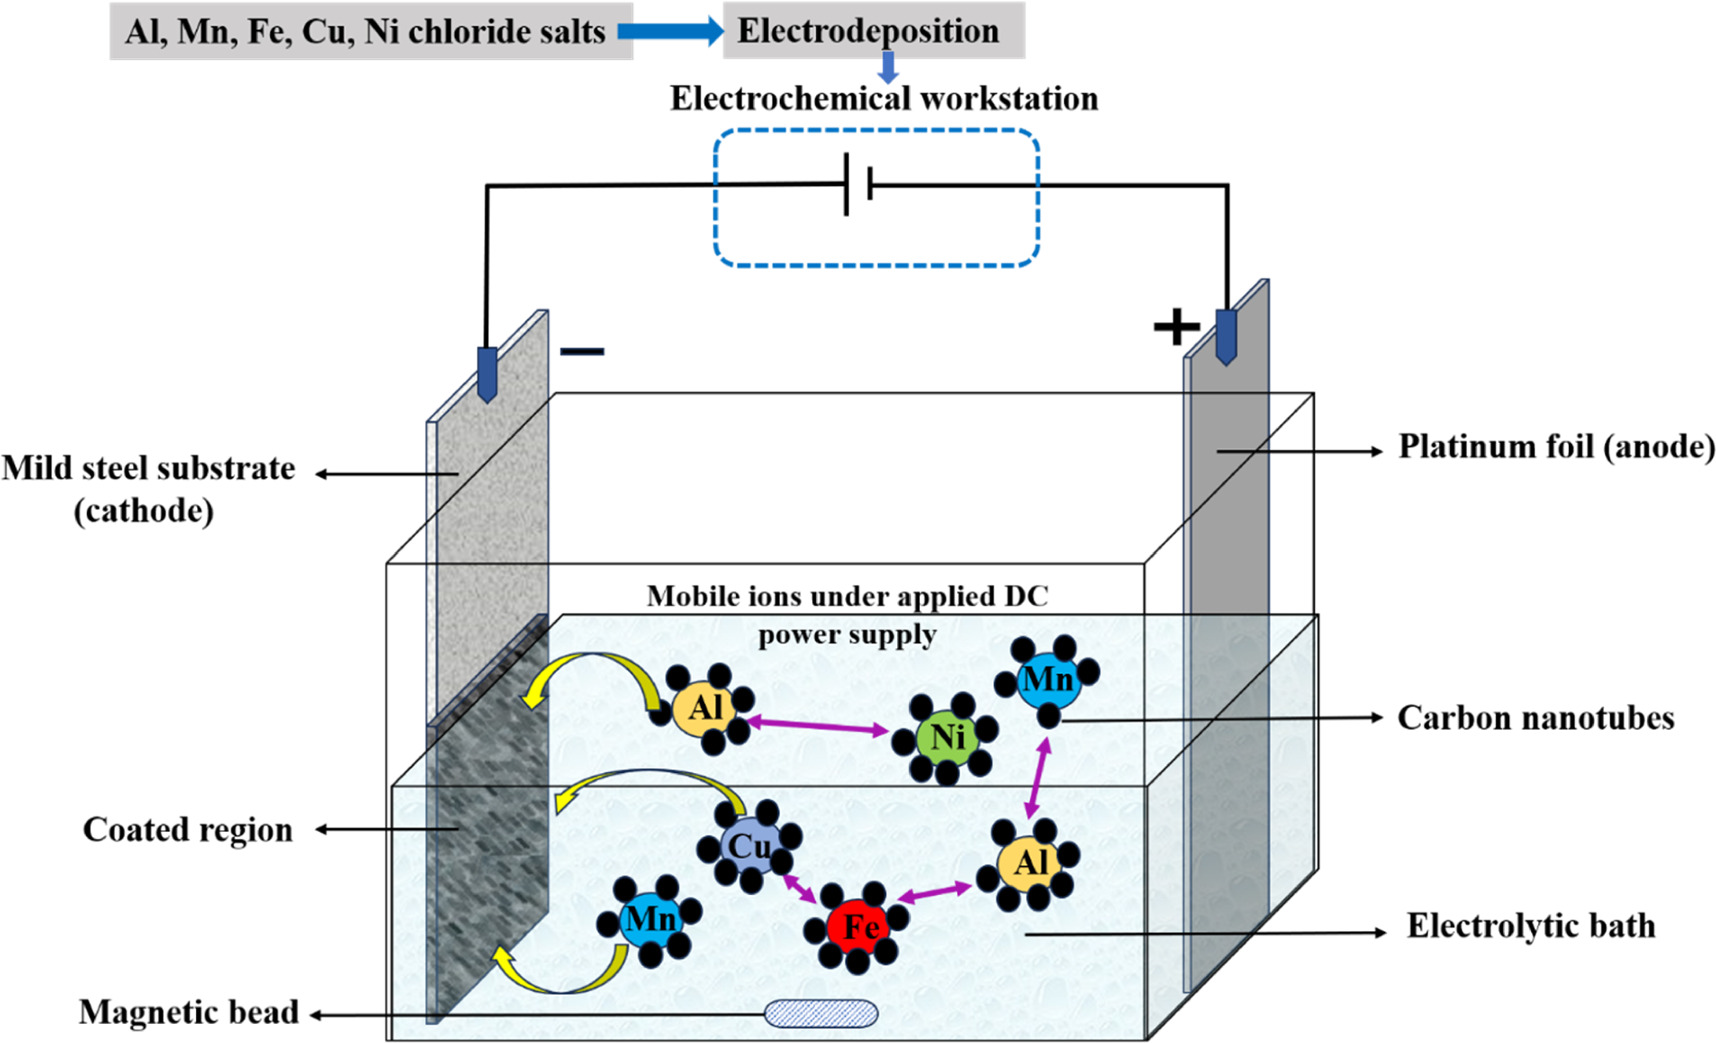
Figure 1. Schematic diagram of sample preparation using chloride based salts with and without CNT.
Download figure:
Standard image High-resolution image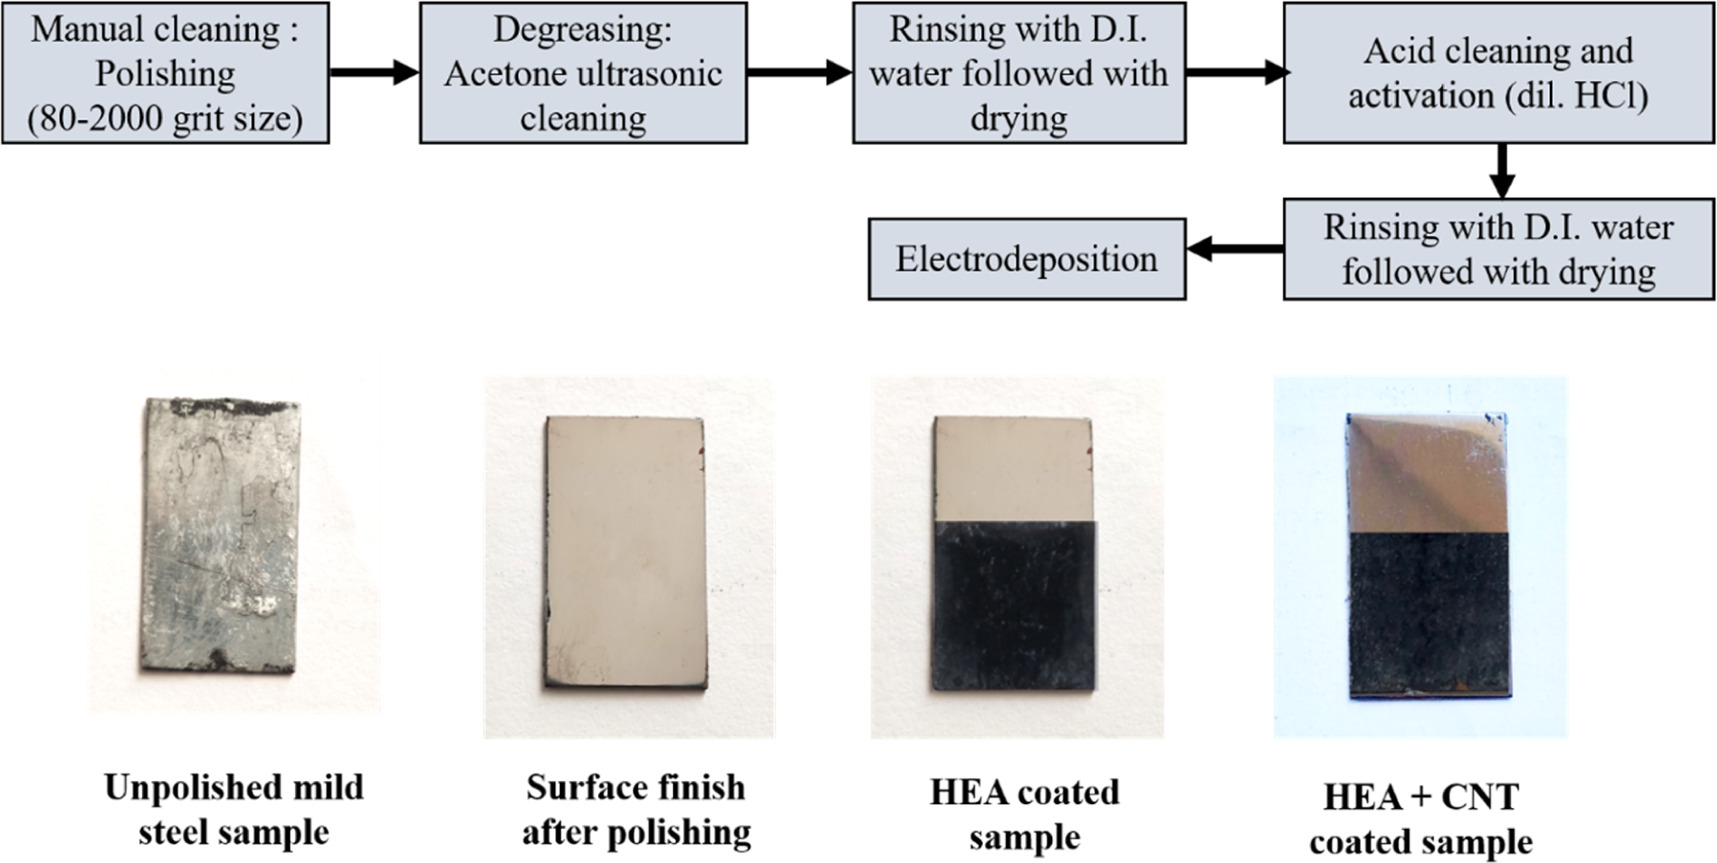
Figure 2. A detailed specimen processing method.
Download figure:
Standard image High-resolution image2.2. Phase analysis and morphological behavior of coated sample
As prepared coatings were characterized for morphological behavior and elemental analysis using Nova Nano SEM 450 scanning electron microscopy (SEM) equipped with energy-dispersive x-ray spectroscopy (EDS). The crystal structure and phase analysis were characterized by x-ray diffraction (XRD) technique which used CuKα as source radiation with 2θ range from 20° to 80° using Panalytical XPert Pro instrument at a scan rate of 0.02˚. Contact angle measurement was carried out using OCA 15 EC instrument equipped with dataphysics software with contour analysis system with the monochromatic light source. De-ionized water droplet is dropped on the surface until a static condition is reached (20 s). An average of three measurements were reported under same conditions and parameters. Zetasizer Nanoseries-ZEN 3690 (Malvern Instruments) were used to measure zeta potential for metal-CNT interaction. Separate baths were prepared using dispersed CNTs (12.5 mg l−1) for individual metal salts having same concentration used for electrodeposition (table 1). The composition of surface oxide formed at the substrate due to coating was studied to understand the passive behavior for the corrosion protection and it was characterized using x-ray photoelectron spectroscopy (XPS) with the help of Omicron Nano Technology instrument. The x-ray source used was Al Kα for XPS. All the data analysis were carried out with respect to adventurous carbon (C 1s peak) having binding energy 284.4 eV. CASA software was used for the peak identification of elements.
2.3. Hardness and scratch test
Vickers hardness of the samples was conducted for microhardness tester under the load of 50 N with a dwell time of 15 s. For an average comparative study five test result values were reported. The coefficient of friction was attained by scratch test using DUCOM scratch tester instrument. Methods available for analysing coating adhesion are force method, energy method and stress method. Force method was implemented which uses stylus for indentation, working at constant and variable load. Diamond indenter was used with tip radius 200 μm for constant scratch length of 10 mm in which a progressive load of range from 1 N to 30 N was applied at with speed of 0.1–2 m sec−1. The constant load scratches were performed at 10, 20, and 30 N. The scratch track profiles were observed using SEM.
2.4. Corrosion behavior measurement
Electrochemical analysis was used for the evaluation of corrosion behavior of the coatings. PG-Lyte 1.0 potentiostat/galvanostat was used for electrochemical studies of AlMnFeCuNi and AlMnFeCuNi -CNT coatings on mild steel substrate. The test was performed in 3.5% NaCl corrosive media solution. A standard three-electrode system using mild steel as working electrode while platinum foil and saturated calomel electrode (SCE) were used as counter and reference electrode respectively. Coated area of 1 cm2 was exposed to corrosive media for one hour to achieve the stability of open circuit potential (OCP) at 0.005 V AC supply to execute the electrochemical impedance spectroscopy (EIS). EIS data analysis and curve fitting was carried out using Zsimp 3.2.1 software in frequency range of 10–2 Hz to 106 Hz. For the reproductivity of the results, this test was conducted four times at room temperature and average results were reported.
3. Results and discussion
3.1. Microstructural analysis
Figure 3 shows the SEM morphology of as deposited AlMnFeCuNi high entropy alloy and AlMnFeCuNi-CNT coatings at lower magnification (figures 3(a)–(c)) as well as higher magnification (figures 3(d)–(f)). The higher magnification of SEM images showed the magnified images to show the presence of CNTs in HCNT1 (AlMnFeCuNi with 12.5 mg l−1 CNT) which were distributed all over the coatings whereas higher amount of CNTs in HCNT2 (AlMnFeCuNi with 30 mg l CNT) can lead to agglomeration in the coating. Compact coating with granular morphology were observed for all the samples. However, more fine granules were observed for HCNT1 as compared to HEA and HCNT2. As per the EDS analysis, figure 4 shows the presence of all the elements. Table 3 shows the average elemental composition of each element present in the coatings for all the samples with at. % between 5% to 35% fulfilling the high entropy alloy criteria. High amount of Cu presence can lead to dendritic structures in morphology which results in non-uniform distribution of elements observed in HEA (figures 3(a) and (d)) and HCNT2 (figures 3(c) and (f)) [17]. Observed EDS mapping in figure 5 showed homogeneous distribution of all the elements for HCNT1 coating. The cross-section images of coatings revealing the coating thickness through SEM imaging is demonstrated in figure 6. The coating thickness of HEA, HCNT1 and HCNT2 coatings were 10 ± 1.56 μm, 5 ± 0.35 μm and 8 ± 1.21 μm respectively. The CNT showed equiatomic presence of elements in HCNT1 whereas HCNT2 lead to increase in Cu composition which can be probably due to the agglomerated CNTs [18]. HCNT1 was observed to more compact and uniform when compared to other coating cross sections and the reason being presence of CNTs.

Figure 3. Surface morphology of (a), (d) HEA, (b), (e) HCNT1 and (c), (f) HCNT2 coatings at lower and higher magnification.
Download figure:
Standard image High-resolution image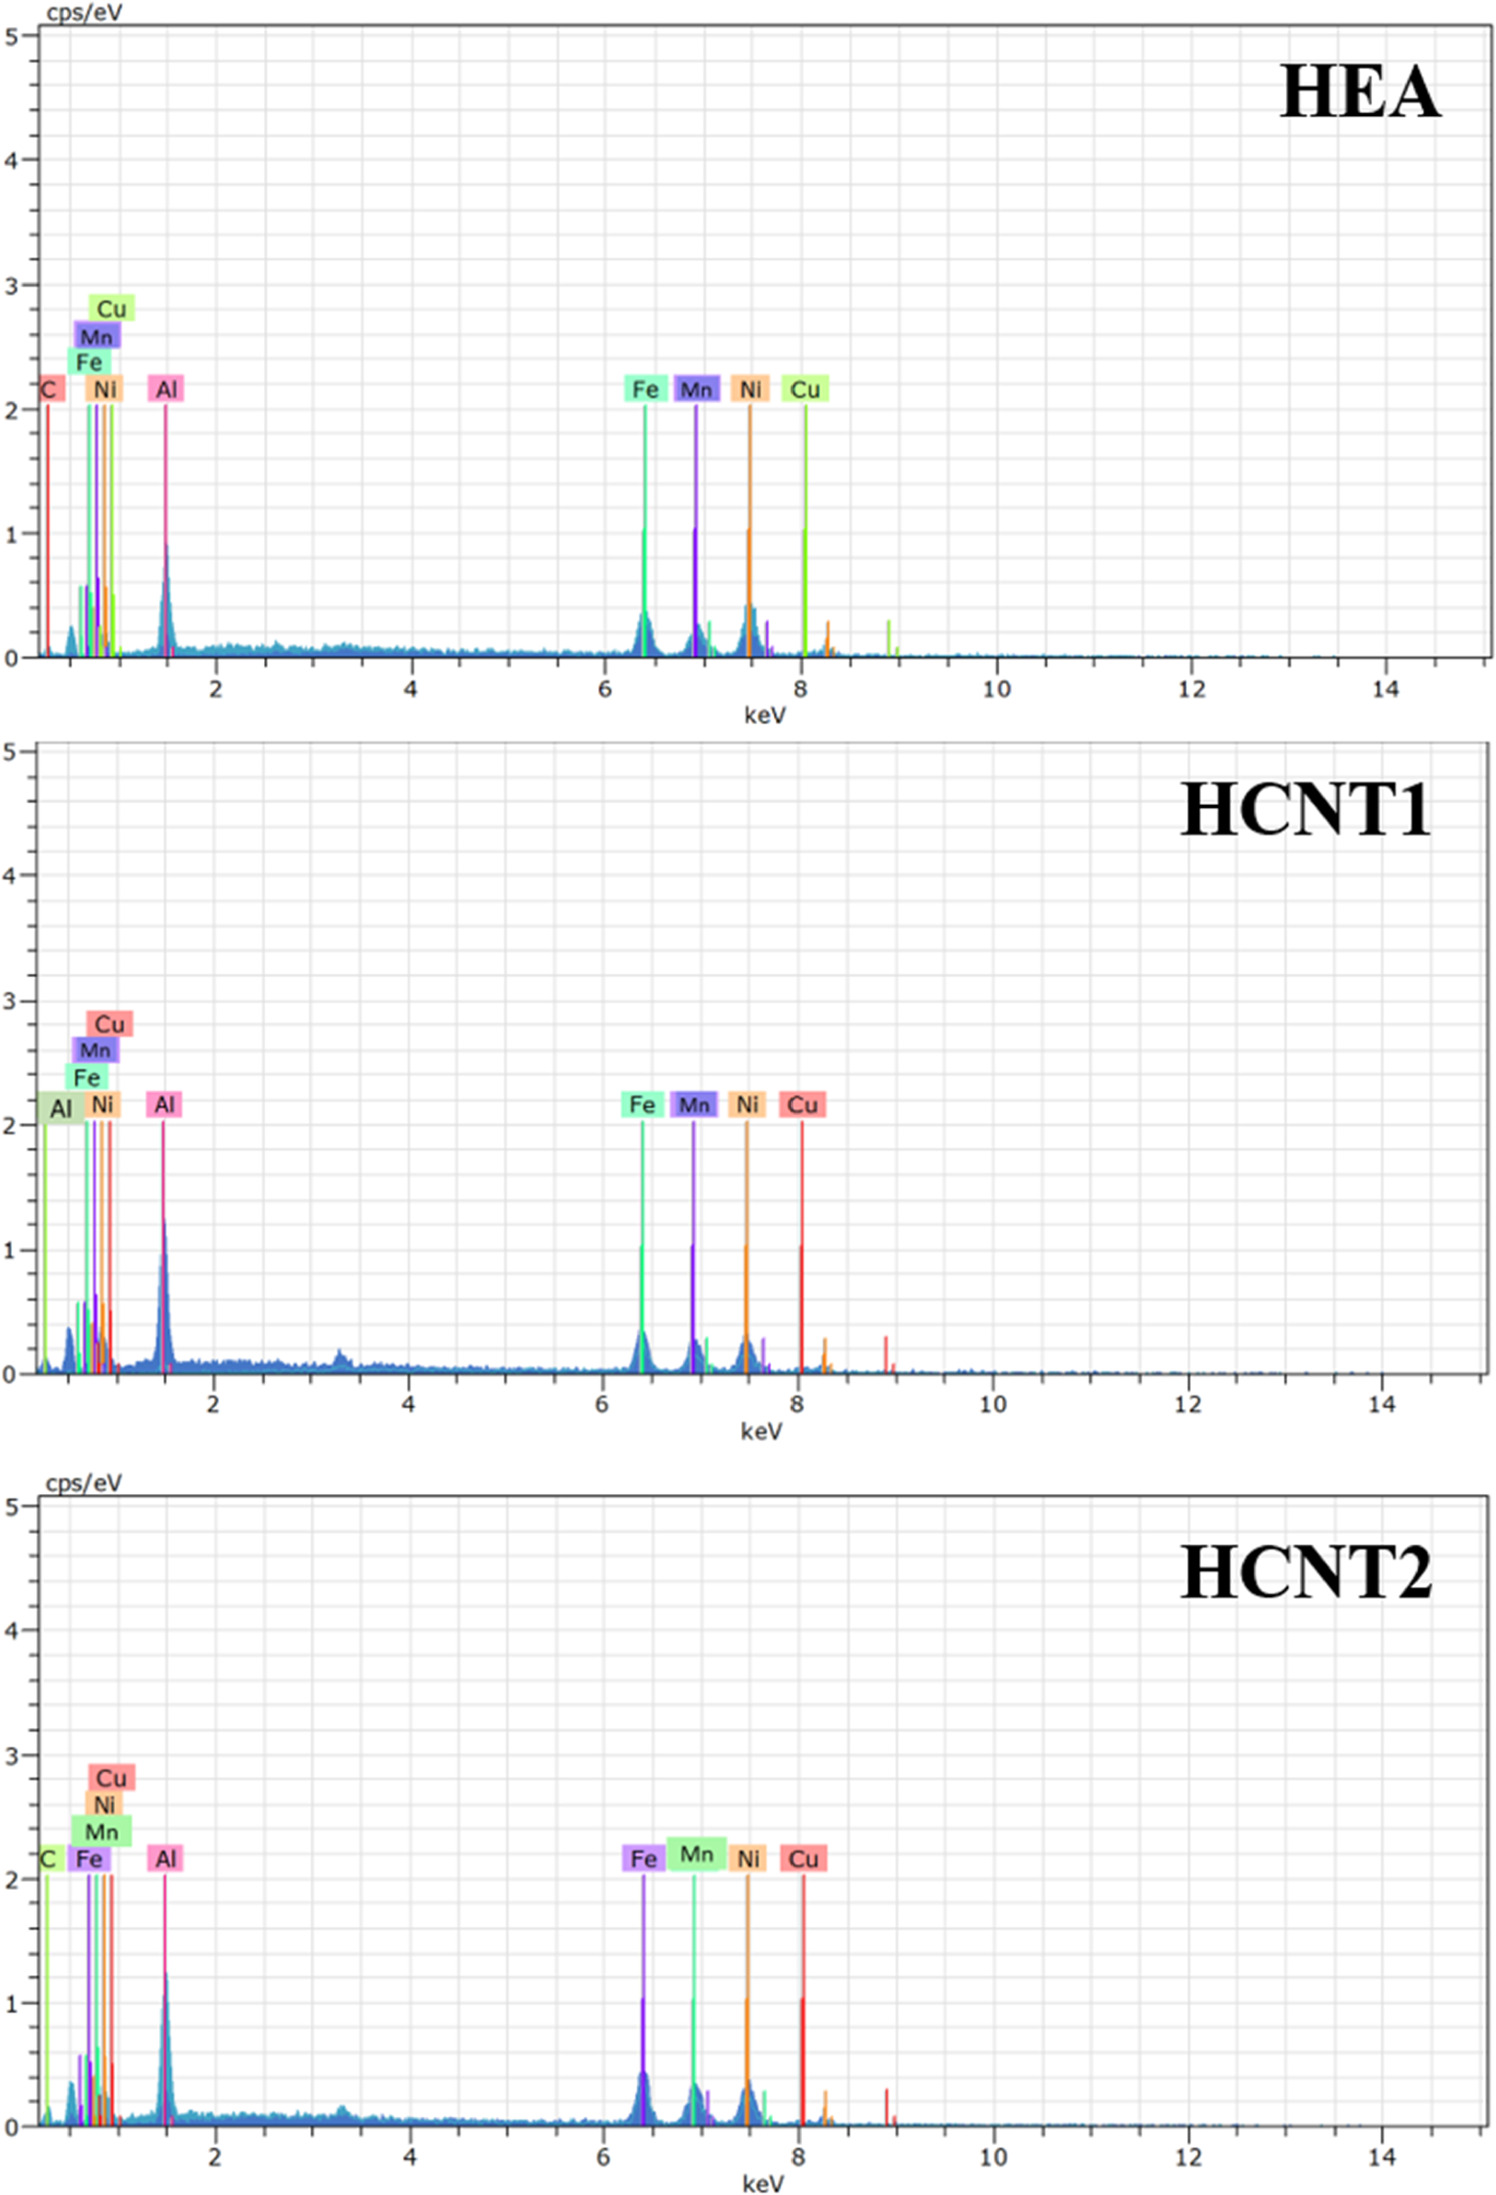
Figure 4. EDS showing presence of each element in all the coatings.
Download figure:
Standard image High-resolution imageTable 3. Average elemental composition of HEA, HCNT1 and HCNT2 coatings.
| Elements | HEA | HCNT1 | HCNT2 |
|---|---|---|---|
| Al | 15.67 ± 3.25 | 22.20 ± 2.02 | 14.23 ± 2.57 |
| Mn | 16.56 ± 2.89 | 17.99 ± 1.59 | 10.94 ± 1.33 |
| Fe | 18.34 ± 2.55 | 17.42 ± 2.53 | 17.18 ± 2.61 |
| Cu | 28.29 ± 1.92 | 15.26 ± 3.71 | 29.31 ± 2.63 |
| Ni | 20.16 ± 2.71 | 21.37 ± 2.63 | 18.52 ± 1.99 |
| C | 0.98 ± 0.03 | 5.76 ± 1.62 | 9.82 ± 3.56 |

Figure 5. EDS-mapping showing distribution of each element in HCNT1 sample.
Download figure:
Standard image High-resolution image
Figure 6. Cross section showing coatings thickness of HEA, HCNT1 and HCNT2 coatings.
Download figure:
Standard image High-resolution imageTo understand the further CNT incorporation along with the elements in coatings, Zeta potential measurements has been carried out to study the response of the metal-CNT (carbon nanotubes) interfaces in electrolytic bath. Six separate electrolytic baths were prepared with individual elements with CNTs containing all the additives to measure the zeta potential. The zeta potential obtained (figure 7) was lowest for Al-CNT i.e. 29.2 mV showing high tendency to adsorbed when compared to other elements. Hence, the Al fraction increases with CNT incorporation initially (HCNT1). Further, Al content is reduced when CNT amount is increased (HCNT2) which can be due to agglomeration of CNTs in the electrolytic bath. The zeta potential for Cu-CNT is high i.e. 49.6 which reduced the presence of Cu in HCNT1 while furthermore increasing its fraction leading to more uneven surface as Cu tends to form dendritic structure. Hence, the addition of CNT in coatings can substantially improve the corrosion resistance which also can be correlated with the elemental compositional variation (table 3).
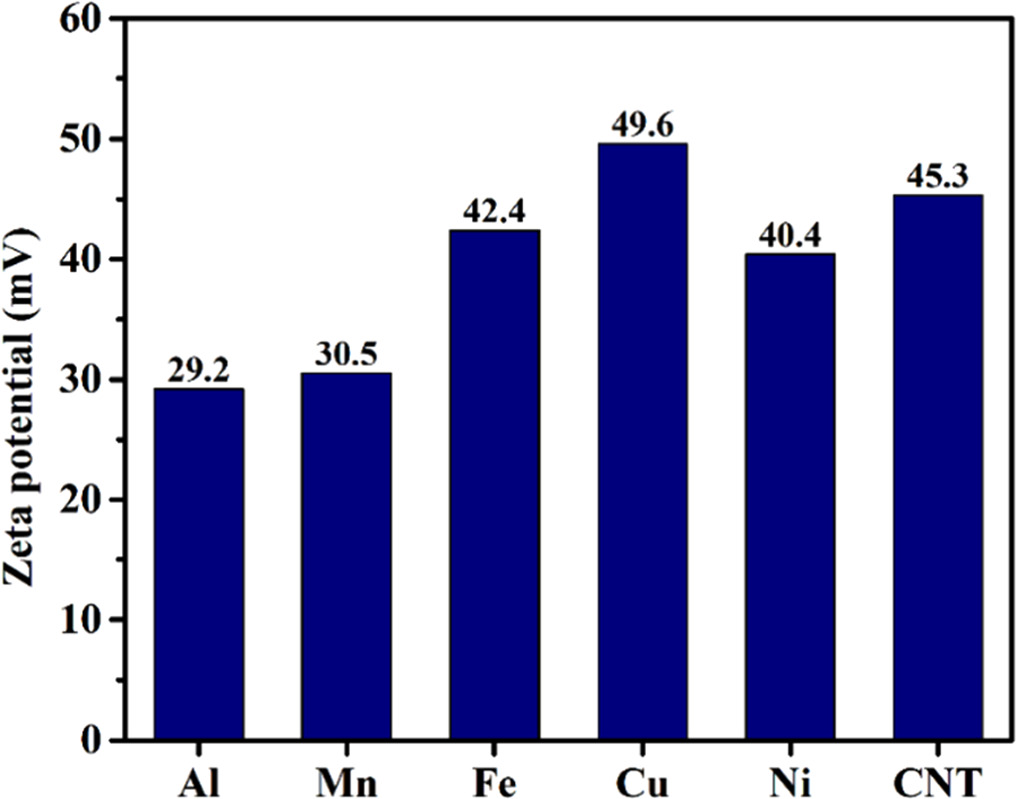
Figure 7. Zeta potential variation of CNT and metal-CNT electrolytic bath.
Download figure:
Standard image High-resolution imageX-ray diffraction of HEA, HCNT1 and HCNT2 can be observed in figure 8. The peaks obtained at 2θ values of 44.71°, 51.91° and 74.17° can be indexed to (111), (200) and (220) planes respectively showing FCC structure. The diffraction lines correspond to FeNi compound and other elements dissolved in the same crystal lattice promoting single phase structure. The maximum elements present in the composition have FCC crystal structure more likely explaining the FCC phase formation. Due to presence of many elements in HEA, diffusion of the elements will be sluggish and will end up with partial solid solubility in the alloy. The high entropy alloy effect, namely dynamic hysteresis diffusion effect, hinders the diffusion of elements in the alloy increasing the solid solubility further increasing the lattice parameter. A slight shift is observed in diffraction peaks which can be caused by the difference in atomic radii of the elements present in the HEA composition. The lattice expansion is caused around the solute atoms due to larger atomic radii of Al and Mn in the amorphous coatings. The presence of Ni acts as FCC stabilizer [19] which explains the stronger intensity of FCC phase diffraction. The compared standard JCPDS with results of XRD analysis showed Fm-3m solid solution space group of FCC phase diffraction peak.

Figure 8. X-ray diffraction pattern showing the phases formation in all the coatings.
Download figure:
Standard image High-resolution image3.2. Tribological properties of coatings
The hardness of the high entropy alloy coatings obtained by using Vickers microhardness tester was 439.4 ± 12 HV for HEA, 562.7 ± 11 HV for HCNT1 and 512.3 ± 14 HV for HCNT2 while that for substrate (MS) was 264.9 ± 10 HV. The hardness for coatings were found higher as compared to substrate. The increase in phase fraction of FCC shows higher hardness value. The lattice distortion effect due to difference in atomic size of Al and other elements can lead to increase in hardness in HEA. Figure 6(a) shows that with HCNT1 shows more refined grains uniformly distributed which results in higher hardness value. However, the presence of CNT in the coatings also enhance the hardness of the coatings. The CNTs incorporation decreases the surface pores resulting in denser morphology which leads to increased hardness. The hardness and wear resistance are directly correlated to each other, higher the hardness of the coatings, better will be the wear resistance [20]. Hence, more hardness of coatings leads to less erosion as compared to substrate.
The friction coefficient is shown in figure 9(b) as obtained by constant load of 30 N at a scratch distance of 10 mm. The average friction coefficient of HEA obtained was 0.72, higher than HCNT1 (∼0.27) and HCNT2 (∼0.49). Importantly, HEA coatings with CNT incorporation shows lower coefficient of friction as compared to HEA coating. The wear mechanism observed is mainly adhesive wear. Figure 10 shows the SEM wear morphologies for HEA, HCNT1 and HCNT2 samples for the obtained wear track at a constant load of 30 N. The EDS analysis was carried out for the elemental analysis to study the abrasive particles. Figure 10 shows the histogram of EDS of spot 1 and spot 2. HEA showed higher amount of Al, Cu, Fe on wear track which also contributed in higher hardness of coatings than the base material. HCNT1 shows excellent wear resistance attributed to high hardness and presence of Cu, Ni elements which can contribute to eradicate abrasive wear behavior. The scratch width for HCNT1 was least among all the samples hence forming a harder coating, decreasing the abrasive wear. The pulled-out grains mainly include Mn, Al, Fe which suggested wear out of less hard elements in HCNT1. The presence of CNT in HCNT1 also imparts higher hardness [21] whereas in HCNT2 although CNT was present, the high amount of agglomeration played a dominant role which lowers the hardness of the HCNT2 coatings. Chipped off abrasive particles can be observed in HEA as well as HCNT2 whereas in HCNT1 a comparatively smoother surface can be observed after abrasion.
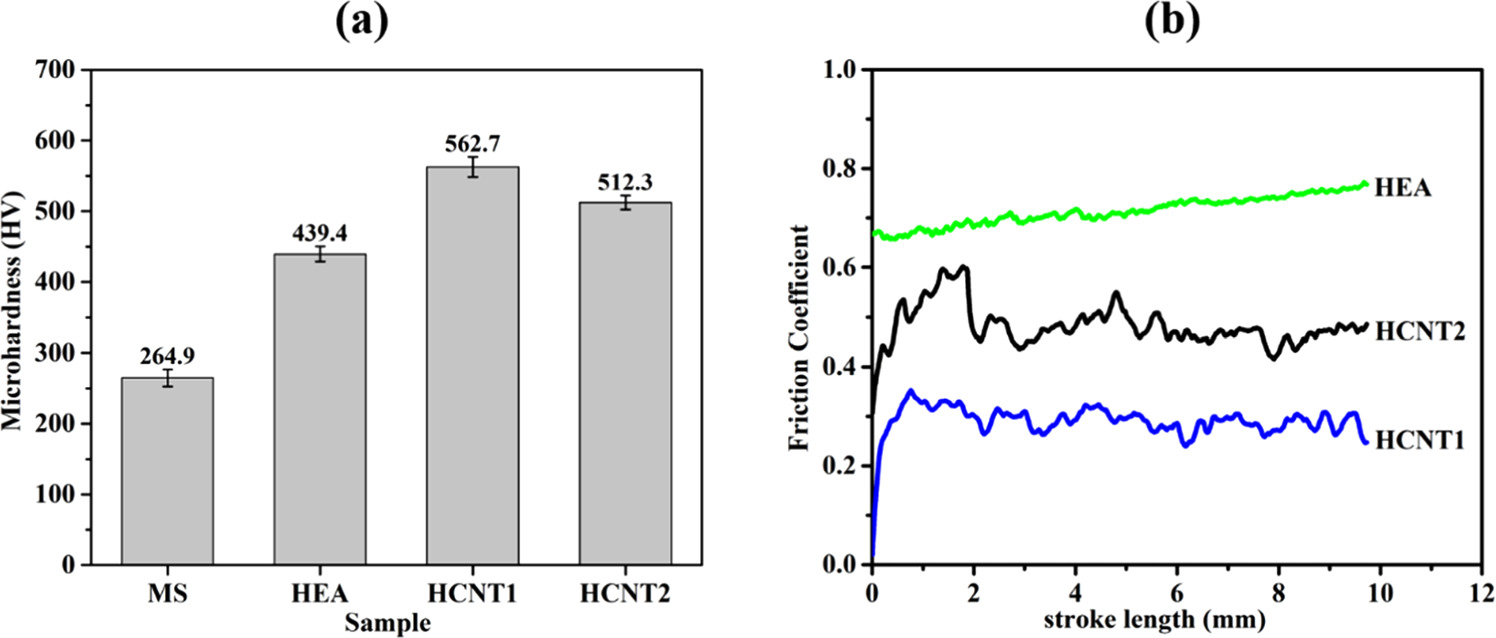
Figure 9. (a) The microhardness distribution and (b) friction coefficient plot of mild steel (MS), HEA, HCNT1 and HCNT2.
Download figure:
Standard image High-resolution image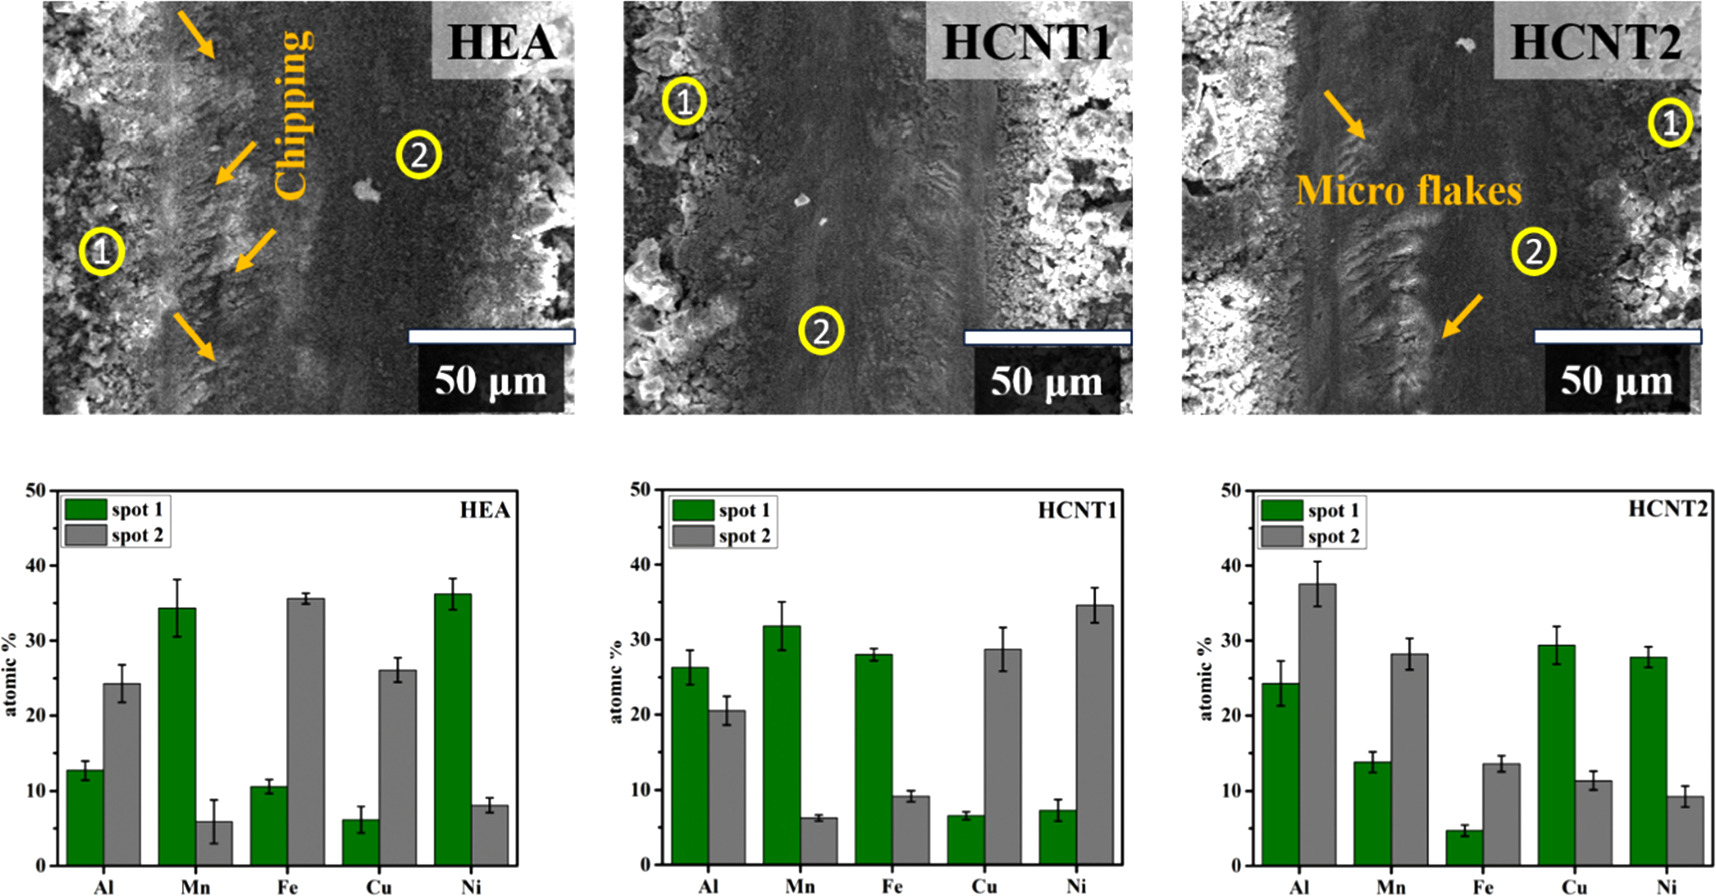
Figure 10. Surface morphology of wear track obtained by scratch test and histogram showing presence of elements at different spots in HEA, HCNT1 and HCNT2 coatings.
Download figure:
Standard image High-resolution image3.3. Tafel polarization
Figure 11 shows the Tafel curves of mild steel (MS), HEA, HCNT1 and HCNT2 samples at room temperature. Corrosion current density (icorr) and Ecorr values were obtained by extrapolating tangents of anodic and cathodic slopes in the Tafel curve. A positive shift from MS to HCNT1 was obtained for Ecorr values from −0.66 V to −0.546 V respectively. However, for HCNT2 again Ecorr value shifted to a more negative value of −0.576 V. HCNT1 reported to have least icorr value (12.58 ± 2.19 μA cm−2) while highest for MS (30.76 ± 3.28 μA cm−2). It was observed that HEA coatings lead to more resistance to corrosion as compared to mild steel while also improving corrosion resistance further with incorporation of CNTs. The higher amount of CNT further in HCNT2 can increase the susceptibility to corrode. Table 4 shows the obtained Tafel parameters. Here the linear polarization obtained for HCNT1 was highest which goes in accordance with the lowest icorr and most positive Ecorr values obtained resulting in least corrosion rate of 1.17 mpy cm−2. Corrosion rate was calculated by using the following equation [22]:
Here icorr represents corrosion current density (μA cm−2), EW represents equivalent weight in g mol−1, d represents density in g cm−3 while A is exposed area in cm2 (1 cm2).
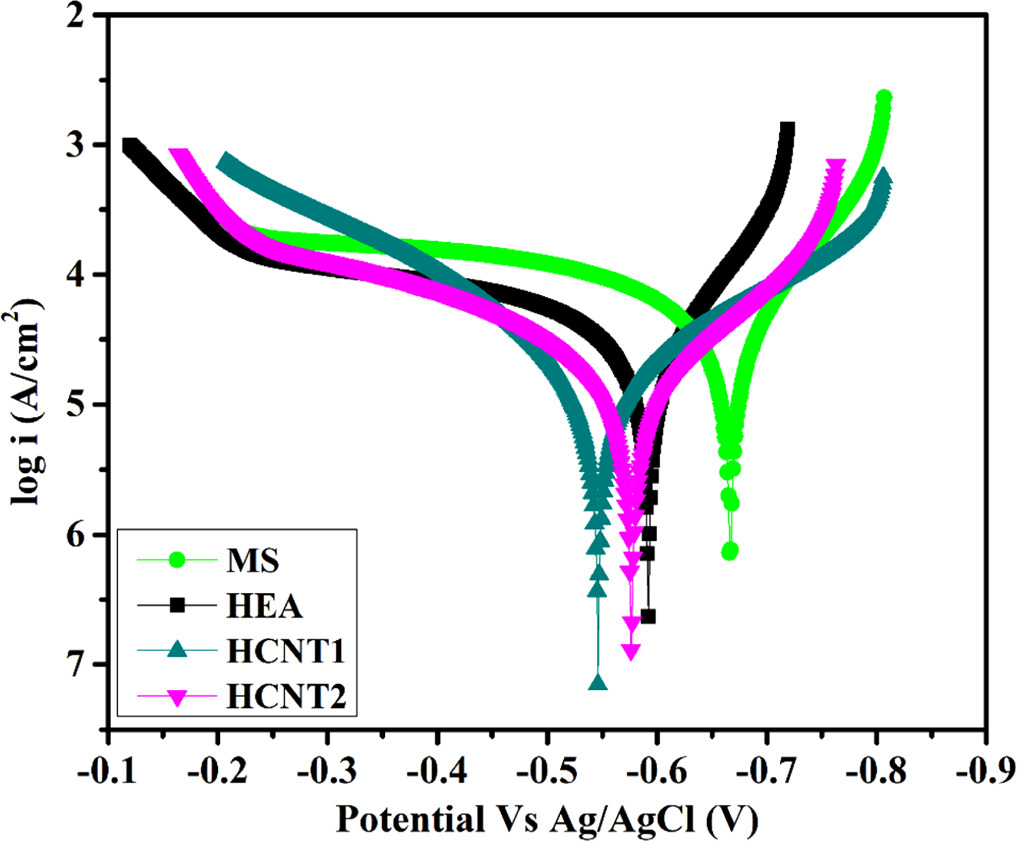
Figure 11. Tafel curves obtained for MS, HEA, HCNT1 and HCNT2 in 3.5% NaCl solution.
Download figure:
Standard image High-resolution imageTable 4. Parameters obtained by Tafel extrapolation for substrate and all coating samples.
| System | icorr (μA cm–2) | Ecorr (V) | Anodic Slope (1/βa)(1 − V) | CathodicSlope (1/βc) (1/V) | Linear Polarisation (Ohm) | Corrosion Rate (mpy cm−2) | Peff

|
|---|---|---|---|---|---|---|---|
| MS | 30.76 ± 3.01 | −0.666 | 6.46 | 10.98 | 810.1 | 2.87 | — |
| HEA | 17.44 ± 2.59 | −0.592 | 8.90 | 13.03 | 1136 | 1.62 | 43.3 |
| HCNT1 | 12.58 ± 2.7 | −0.546 | 6.73 | 5.342 | 2572 | 1.17 | 59.1 |
| HCNT2 | 15.32 ± 2.38 | −0.576 | 6.33 | 7.11 | 2350 | 1.43 | 50.2 |
The calculated protective efficiency was also highest for HCNT1 which was calculated by using the equation [23]:

Where, icoating and iMS is the corrosion current density value for coating and mild steel samples respectively.
3.4. Electrochemical impedance spectroscopy
EIS studies were conducted for all the samples in 3.5 wt% NaCl corrosive media after a constant OCP value was reached. Figure 12(a) shows the Nyquist plots of both measured and fitted data curves for MS, HEA, HCNT1 and HCNT2. Figure 12(b) represents the Nyquist curves at higher frequency. An electrochemical equivalent circuit (EEC) fitting was used for fitting of EIS data which is shown in figure 12(c). The fitted circuit suggests two RC circuits (RC: one resistor and one capacitor) one for each semicircular loops obtained in Nyquist plots. A bigger loop is observed at lower frequency (figure 12(a)) while another smaller loop can be seen in at high frequency Nyquist plots (figure 12(b)). First capacitive loop corresponds to the HEA coating and corrosive media interface which is analogous to coating resistance (Rcoat) and coating capacitive behaviour (Qcoat). The second capacitive loop describes the second RC circuit which is the interaction between the corrosion product formed with the HEA coating corresponding to charge transfer resistance (Rct) and double layer capacitance (Qdl). Rsol is the solution resistance between reference electrode (saturated calomel electrode) and working electrode (Mild Steel/coated samples). Hence the fitted EEC model can be written as: Rsol(Qcoat(Rcoat(QdlRct)). Higher Rcoat value for the HCNT1 samples shows more resistive nature of the coatings than that of others. The ncoat values shows a near pure capacitive behaviour for all the samples. Literature suggests a better corrosion resistance when Rct value is high [24]. A fitting value (χ2) of 10−4 shows more accurate fit. The irregularities in the semicircle are ascribed by parameters n and Q which can also be defined as [16]:

Where, j =  (imaginary number), ω = frequency, n = phase change, Y0 = capacitive amplitude. More is the value of n away from 1, more is the heterogeneity of the surface [25]. When n = 0, it shows resistive nature; n = 1, capacitive behaviour whereas n = −1 shows inductance behaviour. Solution resistance (Rsol) was not much different for all the samples. The higher value of film resistance and charge transfer resistance was observed for HCNT1 while the lowest value for MS. All the fitted parameters obtained are tabulated in table 5. All the near capacitive behaviour was shown by ncoat values near to one.

Figure 12. (a) Nyquist plot, (b) Nyquist plot at high frequency region, (c) Electrical equivalent circuit (d) Bode plots obtained for MS, HEA, HCNT1 and HCNT2 in 3.5% NaCl solution.
Download figure:
Standard image High-resolution imageTable 5. Parameters obtained for all the samples through EEC fitting in 3.5% NaCl solution.
| System | RSol (Ω cm2) | ncoat | Rcoat (Ω cm2) | CPEcoat (Ω−1 cm−2 Sn ) | ndl | Rct (Ω cm2) | CPEdl (Ω−1 cm−2 Sn ) | χ2 × 10⁻⁴ |
|---|---|---|---|---|---|---|---|---|
| MS | 13.38 | 0.97 | 51.4 | 6.29 × 10⁻⁵ | 0.77 | 677 | 0.0034 | 0.49 |
| HEA | 12.96 | 0.99 | 28.6 | 1.14 × 10⁻⁵ | 0.82 | 915 | 0.0017 | 0.37 |
| HCNT1 | 18.15 | 0.99 | 52.7 | 0.76 × 10⁻⁵ | 0.95 | 2144 | 0.0011 | 0.86 |
| HCNT2 | 17.64 | 0.95 | 44.0 | 8.31 × 10⁻⁵ | 0.89 | 1816 | 0.0028 | 0.79 |
Figure 12(d) shows the Bode plots in frequency range of 10−2 Hz to 106 Hz. The Bode phase and Bode mod Z can be divided in two sections; (a) Higher frequency region (10 Hz to 106 Hz): The Bode |Z| shows similar values for all the sample: nearly zero, whereas Bode phase also shows a broadened plateau proposing stabilized passive film formation. (b) Low frequency region (10−2 Hz to 10 Hz): The Bode |Z| plot shows maximum value for HCNT1 while lowest for MS whereas the maximum phase angle was observed for HCNT1 as compared to other samples leading to highest corrosion resistance. Hence a stable coating was suggested for HCNT1 among all the samples. In AlMnFeCuNi-HEA coating, a calculated amount of CNTs can induce chemical homogeneity whereas a large amount to CNTs can lead to agglomeration [18] exhibiting high tendency of corrosion in the coatings.
3.5. X-ray photoelectron spectroscopy
3.5.1. Survey spectrum
XPS technique was used for further investigation of surface oxides formed when exposed to 3.5% NaCl corrosive media by EIS analysis. The same can be observed earlier in Tafel curves as it shows the indication of corrosion due to anodic polarization. A survey spectrum can be observed in figure 13 for pristine coating (HEA) and one having highest corrosion resistance (HCNT1). Presence of all the elements (Al, Mn, Fe, Cu, Ni) were confirmed in the survey spectra of both the samples. No possible auger transition overlaps were observed before analyzing XPS data.

Figure 13. Survey spectrum for HEA and HCNT1 after 1 h exposure in 3.5% NaCl solution.
Download figure:
Standard image High-resolution image3.5.2. High-resolution XPS spectra
A more elaborated discussion of the presence of elements in various oxidation states was carried out by high resolution spectra. These signals include Al 2p3/2, Mn 2p3/2, Fe 2p3/2, Cu 2p3/2 and Ni 2p3/2 spectra and the deconvoluted peak fitting. Figures 14 and 15 shows the curves obtained through deconvoluting each photoelectronic peaks for HEA and HCNT1 respectively. Al 2p3/2 was divided into two components namely, metallic Al (Al0) and Al+3 (Al2O3). Mn 2p3/2 spectra were deconvoluted into metallic Mn (Mn0), Mn+2 (MnO) and Mn+4 (MnO2). Fe 2p3/2 splits into Fe0, Fe+3/Fe+2 (FeO), Fe+3 (Fe2O3), andFe+3 (FeOOH) oxides. Cu 2p3/2spectra was divided in two components, Cu0 and Cu+2 (CuO). The corresponding peaks to Ni 2p3/2 were Ni0, Ni+2 (NiO) and Nihy +2 (Ni(OH)2). The spectrum of O 1s was decomposed in O−2, OH− and H2O. All the values of corresponding binding energies are tabulated in table 6.
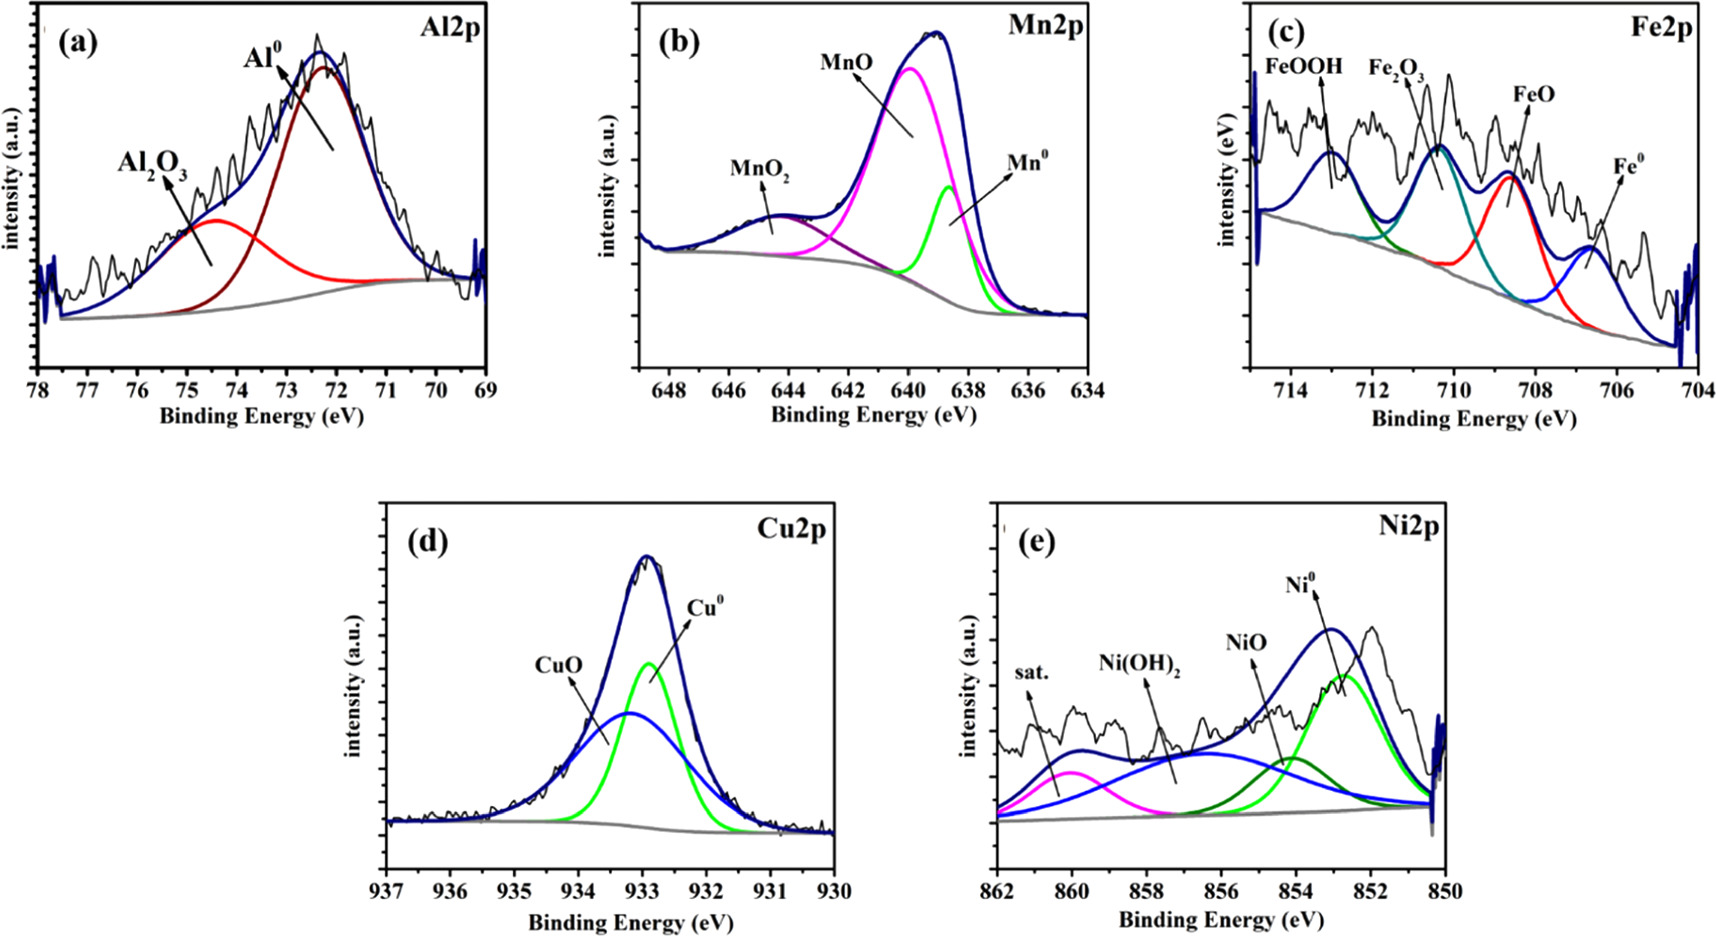
Figure 14. High resolution XPS spectra for HEA after 1 h exposure in 3.5% NaCl solution.
Download figure:
Standard image High-resolution image
Figure 15. High resolution XPS spectra for HCNT1 after 1 h exposure in 3.5% NaCl solution.
Download figure:
Standard image High-resolution imageTable 6. Binding energies of Al 2p3/2, Cu 2p3/2, Fe 2p3/2, Mn 2p3/2, Ni 2p3/2, and O1s by XPS analysis of the surface passive film formed in pristine HEA and HCNT1 coatings after 1 h exposure in 3.5% NaCl solution.
| Elements | HEA | HCNT1 | Proposed compound |
|---|---|---|---|
| Al | 2p3/2 | 2p3/2 | |
| 72.2911 | 72.4716 | Al0 [10] | |
| 74.4923 | 75.0457 | Al2O3 [10] | |
| Cu | 2p3/2 | 2p3/2 | |
| 932.8900 | 932.8901 | Cu0 [24, 26] | |
| 933.1565 | 933.5374 | CuO [24, 26] | |
| Fe | 2p3/2 | 2p3/2 | |
| 706.5917 | 706.0772 | Fe0 [15] | |
| 708.5780 | 708.6731 | FeO [15] | |
| 710.3465 | 711.6554 | Fe2O3 [15] | |
| 712.9730 | FeOOH [15] | ||
| Mn | 2p3/2 | 2p3/2 | |
| 638.6918 | 638.6061 | Mn0 [16] | |
| 639.9314 | 639.8550 | MnO [16] | |
| 644.3213 | 644.2003 | MnO2 [16] | |
| Ni | 2p3/2 | 2p3/2 | |
| 852.7386 | 851.5355 | Ni0 [25, 27] | |
| 854.1339 | 854.6781 | NiO [25, 27] | |
| 856.4552 | 856.8724 | Ni(OH)2 [25, 27] | |
| 860.0599 | 860.9056 | sat | |
| O | 1s | 1s | |
| 530.1278 | 530.7669 | O2 − [10] | |
| 531.4577 | 531.6862 | OH− [10] | |
| 532.0023 | 532.7544 | H2O [10] |
3.5.3. Quantitative analysis-cationic fraction
Figure 16 shows the graphical representation of all the oxidation states of the elements present in HEA and HCNT1 coatings after corrosion in 3.5% NaCl corrosive media respectively. The decreasing order of concentration of elements and their respective oxides after corrosion are summarized as:

Figure 16. Histogram representing Relative contents of Al, Cr, Ni, Co, Fe, and Cu in various states in the surface passive film formed in pristine HEA and HCNT1 coatings after 1 h exposure in 3.5% NaCl solution.
Download figure:
Standard image High-resolution imageHEA: MnO > Al0 > CuO > Cu0> Ni(OH)2 > Ni0 > Al2O3 > FeO > Fe2O3 > FeOOH > Fe0 > Mn0 > NiO > MnO2
HCNT1: MnO > Cu0 > Al0 > FeO > Al2O3 > CuO > Fe0 > Fe2O3 > Ni(OH)2 > NiO > Mn0 > Ni0 > MnO2
The relative contents of all the elements in various states present in the oxide film are tabulated in table 7. The area under the photoelectron peaks corresponds to the presence of the respective constituents. The immersion in corrosive media increases the oxides and hydroxides concentration reducing the metallic states of the elements. The after-corrosion results of HEA and HCNT1 showed dominant behavior of MnO oxides which exhibits the stability of both the coatings [28]. Although, the more stable coatings of HCNT1 can be specified by increase in relative content of stable oxides such as: FeO, Al2O3 and decrease in less-stable oxides and hydroxides: Fe2O3, FeOOH, Ni(OH)2 and CuO. The absence of FeOOH and decrease in Ni(OH)2 lead to more compact coatings as hydroxides have porous structures which is highly unstable. In HCNT1, Al2O3 is slightly higher than in HEA which suggests a behavior of stable oxides. Al is said to form a naturally formed oxide film forming most stable product at room temperature [29]. The oxidation of Al follows the equation:

Table 7. Relative contents of Al, Cr, Ni, Co, Fe, and Cu in various states in the surface passive film formed in pristine HEA and HCNT1 coatings after 1 h exposure in 3.5% NaCl solution.
| Elements | HEA | HCNT1 | Proposed compound |
|---|---|---|---|
| Al | |||
| 65.71 | 61.98 | Al0 | |
| 34.29 | 38.03 | Al2O3 | |
| Cu | |||
| 41.8 | 62.95 | Cu0 | |
| 58.19 | 37.05 | CuO | |
| Fe | |||
| 20.01 | 32.98 | Fe0 | |
| 30.30 | 43.02 | FeO | |
| 29.51 | 24.0 | Fe2O3 | |
| 20.18 | FeOOH | ||
| Mn | |||
| 17.72 | 18.04 | Mn0 | |
| 68.41 | 67.19 | MnO | |
| 13.87 | 14.77 | MnO2 | |
| Ni | |||
| 35.27 | 17.82 | Ni0 | |
| 14.42 | 21.93 | NiO | |
| 38.10 | 22.85 | Ni(OH)2 | |
| 12.20 | 37.40 | sat |
The presence of MnO can reduce ionic diffusion and enhance corrosion resistance [30]. The corrosion of Mn can be written as:


FeO is one of the major constituents in HCNT1. Literature suggests FeO has more protective nature than Fe2O3 and FeOOH. The increase in Fe2O3 can deteriorate the corrosion resistance but a formation of FeO oxide can stabilize the passive layer. Fe2O3 is flaky and powdery oxide which can promote rust and cannot protect the corrosive media seeping. The ratio of stable oxide (FeO) to non-stable oxide (Fe2O3 + FeOOH) were higher in HCNT1 coating. Hence, higher density of FeO forms more compact and robust protective layer reducing corrosion [31]. Hence the possible route of formation of FeO are shown in equations:


CuO being the predominant oxide in HEA and due to its detrimental nature in corrosion properties the compactness of the coating degrades with its presence [32]. It enhances the charge transfer, reducing the passivation when subjected to chloride environment hence resulting in increased rate of corrosion. The predominant corrosion reaction for Cu can be written as:


Metallic Ni has fully filled d orbitals which lowers the oxidation kinetics defending the formation of metallic Ni comparatively higher amount in HEA. Ni2+ oxide has lower diffusion rate hence having higher cationic fraction in HCNT1 promoting stability [33]. The presence of shakeup satellite can be attributed to plasmon loss which can be observed in both the samples. The formation of Ni(OH)2 and NiO in the passive films can be summarized as:


The surface oxide chemistry can be corelated to enhanced corrosion resistance of HEA with CNT addition. Unlike the HEA coating, containing metallic oxides in higher amount after corrosion samples, the incorporation of CNT promoted the formation of more stable oxides (MnO, FeO, Al2O3) which helps in improving the corrosion resistance in 3.5% NaCl solution. The CNT addition in the HEA coating matrix not only enhance the surface chemistry of the coatings but imparts hydrophobicity with consequent enhancement corrosion resistance of HCNT1 coatings.
Water contact measurements were carried out for the substrate and coated samples to study the wetting behaviour. Figure 17 shows the measured contact angles, lowest for mild steel 61.6 ± 1.5° and 83.4 ± 2.3° for HEA showing hydrophilic nature. Contact angle was observed to be increased for HCNT1 and HCNT2 after CNT incorporation introducing hydrophobicity to the coatings. Fraction of air pockets using Cassie Baxter equation [34] was calculated to be 67.64% with remarkable surface hydrophobicity (contact angle 121.5 ± 3.6°), preventing the corrosive medium pervasion by forming a barrier between electrolyte and coating boundary. Although, HCNT2 shows 120.9 ± 2.8° contact angle the surface defects present due to agglomeration of CNTs plays a prevalent role, setting back the benefits which prevails for hydrophobic surface.
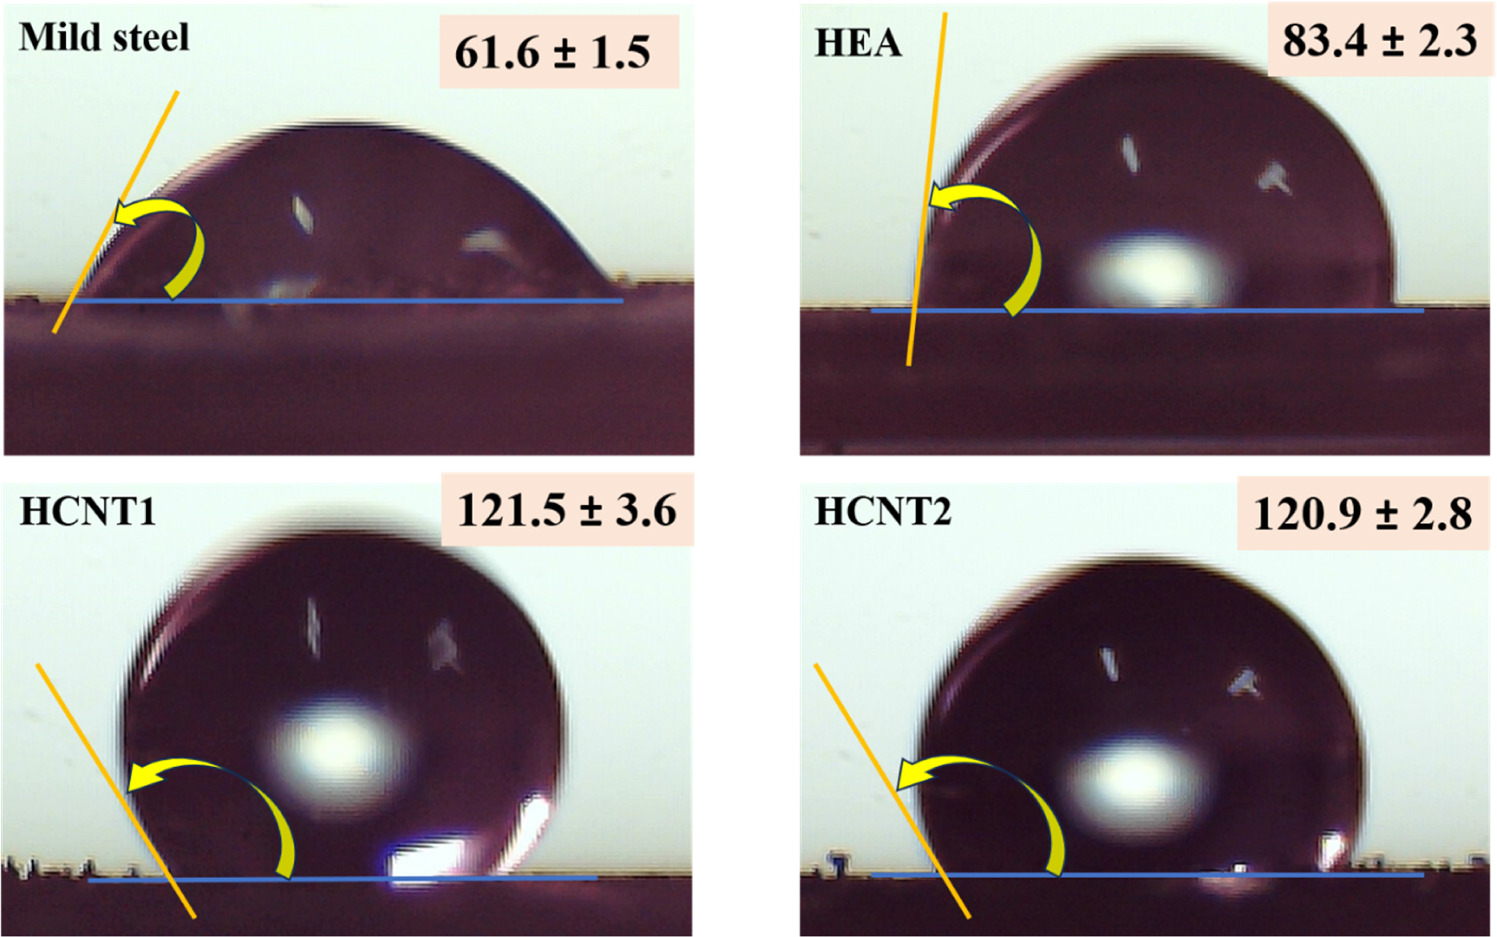
Figure 17. Contact angle measurement for all the samples.
Download figure:
Standard image High-resolution imageAccording to the above-mentioned test results, an elaborative discussion can be carried out by protection mechanism schematic of passive film for HEA and HCNT1 as shown in figure 18 observing the effect of hydrophobicity with the presence of CNTs. HEA coatings when exposed to salt water corrosive media, the chloride ions present easily penetrate through the unstable and porous oxide layer by electrochemically reacting to weak sections (unstable and ruptured) of the film. In case of HCNT1, the infusion of electrolyte is hindered which could be due to the three leading reasons. (a) Uniform distribution of elements and homogeneous phase formation playing a role in forming a compositionally uniform protecting oxide film. (b) the calculated fraction of air pockets i.e. 67.64%, induce hydrophobicity which prevents the corrosive media from the exposed substrate. (c) the density of predominantly oxide present, FeO, MnO have higher density and are more stable than the hydroxides present (FeOOH, Ni(OH)2). Hence, denser and thicker the oxide layer more protective will be the physical barrier preventing the detrimental chloride ions to penetrate. Hence CNTs when in optimum amount plays a vital role improving the corrosion resistance.

Figure 18. Protection mechanism of passive film formed in (a) HEA and (b) HCNT1 after exposure to 3.5% NaCl corrosive media.
Download figure:
Standard image High-resolution image
4. Conclusions
AlMnFeCuNi HEA was deposited with and without incorporation of CNT to study the surface morphology, phase formation, corrosion properties, surface oxide chemistry and wear performance on mild steel substrate. The corrosion investigation was performed using 3.5% NaCl as corrosive media drawing following key conclusions:
- (1)The optimized parameters with suitable bath chemistry produced crack free, uniform and compact coatings for AlMnFeCuNi HEA and AlMnFeCuNi HEA-CNT. The elemental composition obtained showed the presence of elements between 5 at.% and 35 at.% concluding high entropy formation.
- (2)The AlMnFeCuNi HEA and HEA-CNT coatings exhibited face centered (FCC) phase. SEM observation suggest more fine and compact coating morphology of HCNT1 with least thickness of 5 ± 0.35 μm.
- (3)Least chipping and smaller width of wear track was obtained in HCNT1 samples resulting in higher hardness value of 562.7 HV.
- (4)The potentiodynamic polarisation measurements revealed Ecorr value in decreasing order as: HCNT1 > HCNT2 > HEA > MS and icorr value in increasing order as: HCNT1 < HCNT2 < HEA < MS indicating enhanced corrosion performance with CNT addition and least corrosion for HCNT1 coatings.
- (5)Highest (charge transfer resistance) Rct value 2144 Ω cm2 obtained for HCNT1 among all the samples showed highest corrosion resistance. The obtained data showed that after AlMnFeCuNi HEA deposition it enhances the corrosion resistance in substantial amount.
- (6)Results of XPS analysis revealed that CNT incorporation in AlMnFeCuNi matrix enriched the formation of more stable oxides (Al2O3, MnO, FeO) which reduces ionic diffusion enhancing corrosion resistance of the coatings.
Acknowledgments
The authors acknowledge the Material Research Centre facilities in MNIT Jaipur for the work.
Data availability statement
All data that support the findings of this study are included within the article (and any supplementary files).