


Abstract
The first JWST spectroscopy of the luminous galaxy GN-z11 simultaneously established its redshift at z = 10.6 and revealed a rest-ultraviolet spectrum dominated by signatures of highly ionized nitrogen, which has so far defied clear interpretation. We present a reappraisal of this spectrum in the context of both detailed nebular modeling and nearby metal-poor reference galaxies. The N iv] emission enables the first nebular density measurement in an apparently predominantly star-forming galaxy at z > 10, revealing evidence for extremely high densities ne ≳ 105 cm−3. With a suite of photoionization models, we establish that regardless of the ionization mechanism and accounting for depletion and this density enhancement, gas substantially enriched in nitrogen ([N/O] = +0.52 assuming the nebular emission is dominated by star formation) is required to reproduce the observed lines. We compare the GN-z11 spectrum to local UV databases and highlight a unique nearby galaxy, Mrk 996, where a high concentration of Wolf–Rayet stars and their CNO-processed ejecta produce a UV spectrum remarkably similar in some respects to that of GN-z11 and the Sunburst Arc. Collating this evidence in the context of Galactic stellar abundances, we suggest that the peculiar nitrogenic features prominent in GN-z11 may be a unique signature of intense and densely clustered star formation in the evolutionary chain of the present-day globular clusters, consistent with in situ early enrichment with nuclear-processed stellar ejecta on a massive scale. Combined with insight from local galaxies, these and future JWST data open a powerful new window into the physical conditions of star formation and chemical enrichment at the highest redshifts.
Export citation and abstract BibTeX RIS

Original content from this work may be used under the terms of the Creative Commons Attribution 4.0 licence. Any further distribution of this work must maintain attribution to the author(s) and the title of the work, journal citation and DOI.
1. Introduction
With JWST operational, some of the earliest epochs of star formation are now within reach. Many questions remain about these early times, from the properties and distribution of the first unenriched stellar populations to the character of stellar mass assembly across different high-redshift halos (e.g., Bromm & Larson 2004; Bromm & Yoshida 2011; Robertson 2022, for reviews). One of the most clear predictions about this era is that many galaxies must have been host to bursts of extremely intense, highly clustered star formation. The evidence for and antecedents of at least some of these episodes are the large populations of globular clusters in the present-day Universe, whose typical metallicities ([Fe/H] ∼ −2.5–−0.5; Harris 1996; Brodie & Strader 2006) and inferred ages (uncertain, but ranging from ∼10 to ≳13 Gyr; Vandenberg et al. 1996; Brodie & Strader 2006) establish many as potentially forming at z ≳ 5 (e.g., Renzini 2017).
Detailed study of globular clusters has also provided a mysterious clue about the character of the star formation episodes that produced them. Essentially all globular clusters differ from a single simple stellar population: and in particular, a substantial fraction of their stars (their enriched or second population) contain variations in light and heavy element abundances consistent with the yields of high-temperature nuclear burning (specifically, the CNO process and proton-capture chains, which produce abundant N, Na, and Al) that sharply distinguish them from field star populations (e.g., Osborn 1971; Smith 1987; Gratton et al. 2004; Carretta et al. 2005, 2010). However, the exact origins of these abundance patterns remain unclear, and even the basic question of whether these patterns were inherited from earlier generations of stars or are an evolutionary effect remains unsettled (see, e.g., the discussion in Bastian & Lardo 2018).
The great promise of JWST lies in its ability to begin to inform mysteries about the early Universe like these by directly probing high-redshift star formation in situ. Deep Hubble Space Telescope (HST) imaging had already unveiled extremely compact star-forming clumps at z ∼ 2–10 via gravitational lensing with star formation rate (SFR) surface densities and radii approaching expectations for proto-globular clusters (e.g., Rigby et al. 2017; Vanzella et al. 2017, 2021; Welch et al. 2023). However, these clumps were typically too faint even with lensing for spectroscopic study pre-JWST, with the exception of the most massive and lowest-redshift lensed examples (e.g., Mestric et al. 2023; Pascale et al. 2023). JWST imaging alone has already begun revolutionizing our understanding of this area, with some of the first images revealing surprisingly dense clusters in lensed fields including evidence for ancient globular clusters already in place at z ∼ 1 (Mowla et al. 2022; Claeyssens et al. 2023) and bright z ∼ 6–8 galaxies uniformly resolving into small star-forming clumps even in the rest optical (Chen et al. 2023).
The first JWST rest-UV and optical spectroscopy at these highest redshifts have already provided substantial insight into the physical conditions in the earliest star-forming galaxies. These data have confirmed that many z ∼ 6–8 systems are undergoing intense bursts of star formation, and revealed evidence for moderately low metallicities that suggest a fairly rapid build-up of metals in these systems (e.g., Arellano-Córdova et al. 2022; Schaerer et al. 2022; Trump et al. 2023; Jones et al. 2023; Tang et al. 2023). The rest-frame UV is a particularly powerful portion of these spectra, providing insight into massive stars and highly ionized gas in these systems. With a few uncertain exceptions, the rest-UV spectra obtained thus far are reasonably close in agreement to those of typical metal-poor star-forming galaxies in the local Universe, where C iii], O iii], He ii, and C iv are the most prominent transitions (e.g., Senchyna et al. 2017; Berg et al. 2019a; Senchyna et al. 2019; Mingozzi et al. 2022).
In contrast, JWST observations of GN-z11 have consistently reinforced the standout nature of this object relative to lower-redshift samples. GN-z11 was the first spectroscopically confirmed galaxy at z > 10 (Oesch et al. 2016). Its confident early identification as a J125-band Lyman-break dropout candidate in HST/WFC3/IR imaging (Oesch et al. 2014) was due to its remarkable UV luminosity: MUV = −22, roughly a magnitude (3×) brighter than the characteristic luminosity derived at z ∼ 7–8. A range of observations of GN-z11 were conducted as part of the JWST Advanced Deep Extragalactic Survey (JADES) in 2023 February. Results from deep imaging with NIRCam were described by Tacchella et al. (2023), revealing a compact morphology dominated by a ≲200 pc half-light radius core with at least half the total light in an unresolved point-source component. Population synthesis modeling fits to the JWST photometry indicate that this core harbors a ∼108–9 M⊙ stellar population formed within the last ∼10–20 Myr, with a current SFR of ∼20 M⊙ yr−1 and corresponding specific star formation rate (sSFR, SFR/M⋆) of ∼20–30 Gyr−1. This dominant clumpiness is in keeping with the properties of other luminous z ≳ 6 galaxies observed with JWST (e.g., Chen et al. 2023); but for such a particularly luminous source to resolve into a single nearly unresolved core is surprising. The SFR surface density implied by these observations is ΣSFR ≳ 40 M⊙ yr−1 kpc−2—a range reached only by the most intense blue compact dwarfs and ultraluminous infrared galaxies in the local Universe (e.g., Kennicutt & Evans 2012).
The JWST/NIRSpec spectra reported by Bunker et al. (2023, hereafter B23) are yet more surprising. The rest-UV spectrum of GN-z11 is dominated by emission lines, with the most prominent being N iv] λ1486 and N iii λ1750, followed by C iii] λ λ1907, 1909 (hereafter, we refer to the combined doublet as C iii] λ1908). This is in stark contrast to star-forming galaxy samples at lower redshifts, where these transitions are rarely detected and essentially always at substantially lower flux than the O iii] doublet (e.g., Amorín et al. 2017; Mingozzi et al. 2022; Saxena et al. 2022). In a follow-up analysis, Cameron et al. (2023, hereafter C23) suggest this spectrum requires extremely elevated N/O > −0.5, and discuss scenarios including runaway stellar collisions producing extremely massive stars or tidal disruption events that might be capable of reproducing the spectral features The possibility of an active galactic nucleus (AGN) has also been invoked, though it is unclear whether this readily explains the observed UV line strengths (B23; C23).
In this work, we present a reappraisal of this striking JWST spectrum in the context of nebular models and an extensive search of UV spectra of nearby galaxies. In Section 2, we reconsider the gas conditions implied by the N iv] detection in particular. We proceed in Section 3 to analyze the GN-z11 UV–optical nebular line spectrum in the context of a detailed suite of photoionization models. In Section 4, we seek out lower-redshift star-forming galaxies with UV spectra close to that observed in GN-z11. In Section 5, we combine the inferences from the previous section into a picture of GN-z11 that we consider in a broader context. In this work, we primarily seek to understand this spectrum in the context of the assumption that the nebular emission is powered by star formation, but as argued from follow-up spectroscopy by Maiolino et al. (2024) during the refereeing of this manuscript, part of this emission could be produced instead by a small accreting black hole. We compare to this subsequent analysis where relevant, and return to comment on this in more detail in Section 3.3.
We assume the Planck 2018 cosmological parameters throughout (Planck Collaboration et al. 2020), and adopt the solar abundance patterns compiled by Bressan et al. (2012), primarily relying on Caffau et al. (2011) but modified in the photoionization modeling according to Gutkin et al. (2016). 8
2. Constraints on the Nebular Density from N iv] Emission
The detection of N iv] visible in the NIRSpec grating spectrum of GN-z11 readily provides a clue about the state of the highly ionized gas in the galaxy. The N iv ion is a Be-like 2s2 species analogous to C iii, and N iv] λ1486 is part of a forbidden/semi-forbidden doublet representing the same pair of ground state electronic transitions as [C iii] λ1907 and C iii] λ1909 (see, e.g., Osterbrock & Ferland 2006). The forbidden magnetic quadrupole transition counterpart to the intercombination electric dipole 1486 Å transition is [N iv] λ1483. As with the C iii doublet, the ratio of the two components is sensitive to the electron density ne , with critical densities for the more easily de-excited transition (the bluer component) near 105 cm−3 for C iii and 106 cm−3 for N iv (at Te = 104 K; see, e.g., Osterbrock & Ferland 2006).
Intriguingly, while N iv] λ1486 is strongly detected in GN-z11, no emission is evident in [N iv] λ1483. The JWST/NIRSpec grating spectrum clearly resolves the two transitions at their expected wavelength separation at the redshift of GN-z11. To quantify the constraint the JWST data place on the flux ratio, we analyzed a manually digitized 9 version of the grating spectrum as presented in B23 (their Figure 2). We then fit a pair of Gaussians with flexible but tied widths and wavelength ratio fixed to the expected separation of the two transitions (Kramida & Ralchenko 2022), and repeat this procedure 500 times while bootstrap resampling according to the conservative approximated flux uncertainty vector (we assume this uncertainty vector is constant valued, and scale it to visually match the uncertainty plotted in the original figure). This results in a 1σ upper limit on the F1483/F1486 of <0.18, and conservatively at the 99th percentile level F1483/F1486 < 0.48 (Figure 1). 9

Figure 1. N iv] emission detected in GN-z11 provides evidence for a very high electron density in the emitting gas. Fits to the JWST/NIRSpec grating spectrum place a strong upper limit on the flux of the forbidden [N iv] λ1483 counterpart to N iv] λ1486 (left). Such low inferred flux ratios are indicative of efficient collisional de-excitation of the 1483 transition, achieved at extremely high electron densities ne ≳ 105–106 cm−3 (right). These high densities are rarely found in star-forming galaxies; for comparison, the range of N iv] flux ratios we measure for a set of local metal-poor blue compact dwarfs (Section 4) are plotted in green, and found to be consistent with ne ∼ 104–105 cm−3 or lower.
Download figure:
Standard image High-resolution imageTo interpret this ratio in terms of the nebular physical conditions, we use the code PyNeb (Luridiana et al. 2015) to compute a grid of line emissivities 10 at varying electron temperature Te and density ne . We find that as expected, the ratio of the forbidden to semi-forbidden component F1483/F1486 falls with increasing electron density, and to a lesser degree, with decreasing electron temperature. The resulting predicted line ratios are shown in Figure 1 (right panel) in comparison to the line ratio constraints derived from the JWST spectrum. Even assuming a conservatively low Te = 0.5 × 10⁴ K, the 99% confidence upper limit on the F1483/F1486 flux ratio implies ne ≳ 105–106 cm−3 in the N iv-emitting gas. We note that the results of this analysis are consistent with those derived from deeper follow-up spectra by Maiolino et al. (2024); though their more stringent upper limit of F1483/F1486 < 0.15 (3σ) implies densities at the upper end of this range, ne ≳ 106 cm−3.
As noted above, the analogous C iii] doublet provides a complementary probe of density in lower-ionization gas (ionization potential of 24.4 versus 47.4 eV). Unfortunately, C iii] is not cleanly separated by the medium-resolution NIRSpec gratings used by JADES in the GN-z11 observations, but the profile is resolved and clearly broader than the other nebular lines. We apply the same technique described above to fit the C iii] doublet, assuming a similar line width for each component to N iv]. Consistent with the qualitatively symmetric profile shape, we infer a 1σ confidence interval on the line ratio of  . While not strongly constraining, a similar comparison with
PyNeb
indicates that this confidence interval on the line ratio is consistent with a lower density (ne
≃ 104 cm−3). We briefly note that the N iii] complex is composed of a suite of transitions (most prominently 1748.6, 1749.7, 1752.2, and 1754.0 Å; see, e.g., Keenan et al. 1994) with a more complex density dependence; but it is not strongly sensitive over the considered range, and the profile in GN-z11 is noisy.
11
While tentative, this suggests that either a significant density gradient exists between the regions responsible for N iv] and C iii] emission, or that they arise from distinct ionized regions in the galaxy.
. While not strongly constraining, a similar comparison with
PyNeb
indicates that this confidence interval on the line ratio is consistent with a lower density (ne
≃ 104 cm−3). We briefly note that the N iii] complex is composed of a suite of transitions (most prominently 1748.6, 1749.7, 1752.2, and 1754.0 Å; see, e.g., Keenan et al. 1994) with a more complex density dependence; but it is not strongly sensitive over the considered range, and the profile in GN-z11 is noisy.
11
While tentative, this suggests that either a significant density gradient exists between the regions responsible for N iv] and C iii] emission, or that they arise from distinct ionized regions in the galaxy.
The constraints we have derived here leveraging the N iv] doublet represent the first direct inference on density in a star-forming galaxy at z > 10, and reveal an extraordinarily high electron density of ne ≳ 105 cm−3. Previous studies investigating the evolution of electron density with redshift have found notable increases from z ∼ 0 to 2–3 and recently with JWST out to z ∼ 9 (e.g., Brinchmann et al. 2008b; Hainline et al. 2009; Sanders et al. 2016; Isobe et al. 2023a), but over a disjoint range of densities ne ≃ 102–103 cm−3 probed by the lower-ionization and lower ncrit optical [O ii] and [S ii] diagnostics. Work with the C iii] doublet and other higher-ionization lines like Ar iv have clearly established that in individual star-forming systems both locally and further afield, these lines frequently evince the presence in the same galaxies of much higher density gas (often by orders of magnitude) than implied by lower ncrit tracers (e.g., James et al. 2018; Berg et al. 2021; Mingozzi et al. 2022; Mainali et al. 2023). But even in this context, densities as high as that implied by the limit we place on the N iv] ratio in GN-z11 are exceptionally rare in star-forming galaxies. The C iii] doublet and even N iv] where it is detected at lower redshifts (see Figure 1 and Section 4, and e.g., Berg et al. 2019b; Mingozzi et al. 2022) are essentially always consistent with lower densities of ≲105 cm−3 (though there are some exceptions; for instance, a handful of objects in the COS Legacy Archive Spectroscopic Survey (CLASSY) sample have implied ne (C iii]) ≃ 105 cm−3; Mingozzi et al. 2022). Our measurement in GN-z11 is suggestive of particularly dense conditions in the innermost highly ionized zones of the dominant H ii regions; such high densities are more generally associated with environments such as AGN, ultracompact H ii regions, and nebulae around symbiotic stars composed of dense stellar ejecta (e.g., Kenyon & Webbink 1984; Wood & Churchwell 1989; Véron-Cetty & Véron 2000). In the following sections, we explore the possible implications of this high inferred density and whether analogous processes might help explain their occurrence in this luminous z = 10.6 galaxy.
3. Reproducing GN-z11–like Line Ratios with Photoionization Models
We next turn our attention to understanding the anomalously strong flux of the nitrogen lines relative to the other rest-UV lines in GN-z11. Previous work has analyzed the N iii]/O iii] ratio in particular to constrain N/O > −0.49 in the context of a two-zone nebula model (B23; C23). These analyses represent a critical first step toward constraining the origin of the observed nitrogen emission. Here, we present a complementary analysis designed to address several additional sources of uncertainty. In particular, we explicitly consider (1) the constraints on the ionizing radiation field and ionization correction factor implied by the N iv]/N iii] line ratio; (2) the potential effects of depletion onto dust grains on the gas-phase N/O ratio; and (3) the possible impact of extremely high gas densities (Section 2) on the UV line ratios. In this section, we present the photoionization modeling we perform and comparisons to the observed line fluxes; we reserve some additional details and plots including the line fluxes actually fit for Appendix B. Note that while we compare to AGN models, our model line fitting assumes that the nebular emission is powered by star formation; we return to discuss the possibility of a broad-line AGN contribution (Maiolino et al. 2024) in Section 3.3.
3.1. Photoionization Modeling
To investigate these questions, in this section, we consider the full set of nebular line strengths in GN-z11 in the context of a suite of detailed photoionization models, which we describe here. The primary grid we rely upon is computed with CLOUDY c17.02 (Ferland et al. 2017) using the latest Charlot and Bruzual model predictions as described in detail by Gutkin et al. (2016) and Plat et al. (2019) and summarized here. It employs the latest predictions of the Charlot and Bruzual stellar population synthesis models, which include updated prescriptions for the evolution and atmospheres of massive stars as ionizing sources (see also the discussion in Senchyna et al. 2021, 2022). We vary key parameters including the zero-age volume-averaged ionization parameter 〈U〉, the gas density nH ∼ ne
, as well as N/O. We then produce tracks of line ratios over varying stellar population ages at a range of total metallicities. The fiducial model follows Equation 11 of Gutkin et al. (2016) for the abundances of nitrogen and oxygen, which predicts that N/O increases with oxygen abundance to account for primary and secondary nucleosynthetic components, and reproduces the relatively tight relationship between these abundances found in local star-forming galaxies, H ii regions, and in the field star population of the Milky Way (e.g., Israelian et al. 2004; Berg et al. 2012). This relationship predicts (N/O)tot= −1.8 at  (
( )—this is near the bottom of the envelope of observed N/O in metal-poor dwarfs (e.g., Berg et al. 2019b) after accounting for depletion, which we discuss next.
The impact of dust depletion is particularly crucial in estimating N/O. Since O is refractory and N is not, significant depletion onto dust grains could artificially boost N/O in the gas phase and mimic a genuine nitrogen enhancement. The CLOUDY grid we run incorporates a self-consistent treatment for this effect (see Gutkin et al. 2016), parameterized by the dust-to-metal mass ratio ξd . We consider values of ξd ranging from 0.1–0.3 (near the solar value; Gutkin et al. 2016) up to extremely high values of 0.95 below.
In addition to ionization by stellar populations, we consider model predictions for both narrow-line AGN and fast radiative shocks. For AGN, we compare to the models produced by Feltre et al. (2016) with  , 0.1 < ξd
< 0.5,
, 0.1 < ξd
< 0.5,  , and a power-law index varying from −2 to −1.2. For shocks, we use the radiative shock models of Alarie & Morisset (2019), including both the shock and precursor components. We consider shock velocities varying from 102 to 103 kms−1, a pre-shock density of 102 cm−3, a transverse magnetic field of 1 μ
G, and interstellar medium (ISM) metallicities of
, and a power-law index varying from −2 to −1.2. For shocks, we use the radiative shock models of Alarie & Morisset (2019), including both the shock and precursor components. We consider shock velocities varying from 102 to 103 kms−1, a pre-shock density of 102 cm−3, a transverse magnetic field of 1 μ
G, and interstellar medium (ISM) metallicities of  . Both models follow the same nominal assumed relation between N/O and O/H as described above.
In Figure 2, we compare key measured line ratios in GN-z11 to these model predictions. First, we compare all three grids in panel (a) of Figure 2 to the observed constraints on N iii]/O iii] versus N iii]/Hδ. The star-forming models plotted span  with Z⋆ = ZISM = Z, 0.1 < ξd
< 0.5, and
with Z⋆ = ZISM = Z, 0.1 < ξd
< 0.5, and  for a 10 Myr constant star formation. The star-forming models with nominal N/O are clearly offset from the observed line ratio in GN-z11, as argued by C23. The radiative shocks and AGN models are capable of powering significantly higher N iii]/Hδ than star-forming galaxy models, reaching closer to the observed line ratios without invoking an enhancement in nitrogen abundance. This reflects the impact of the more highly ionized and hotter gas these models are capable of producing. However, both AGN and shocks with nominal N/O fail to reproduce the large N iii]/O iii] ratio of GN-z11, as well as its large N iii]/C iii] ratio (see Figure B2).
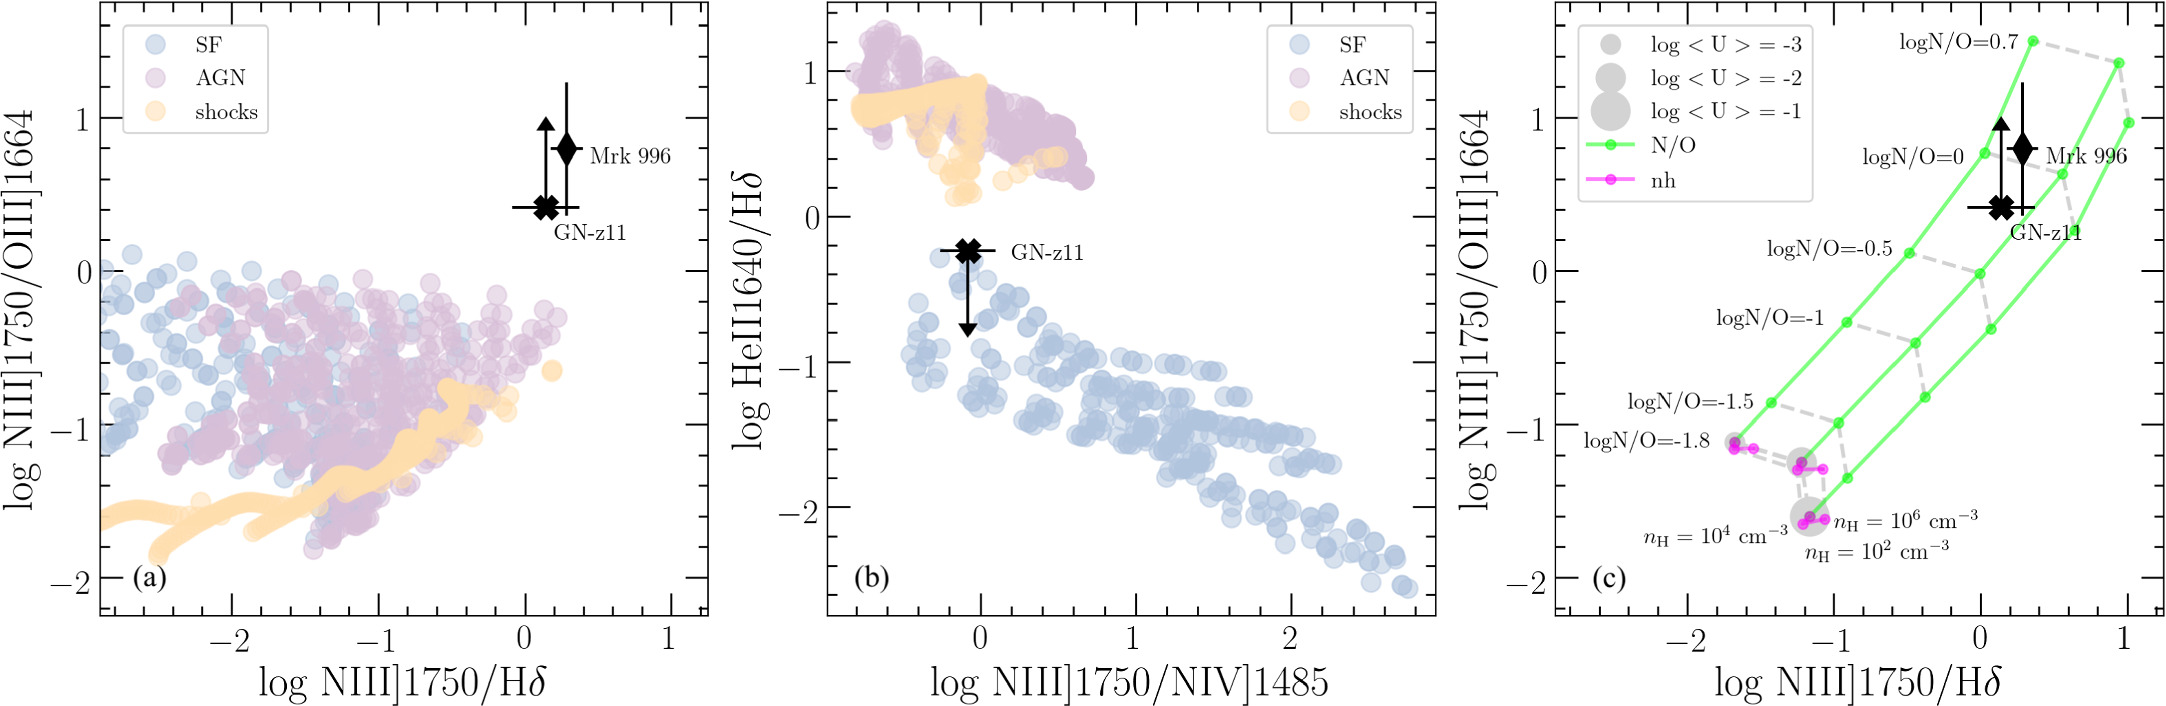
Figure 2. Comparison of GN-z11 (cross) and Mrk 996 (diamond) line ratios with predictions from photoionization models. (a) log10(N iii] λ1750/O iii] λ1664) vs. log10(N iii] λ1750/Hδ). The circles show the predictions from photoionization models for star-forming galaxy models (blue), AGN models of Feltre et al. (2016) (purple), and radiative shock models of Alarie & Morisset (2019) (yellow), all assuming a nominal N/O vs. O/H relationship (see the text). (b) Same as diagram (a) but for log10(He ii λ1640/Hδ) vs. log10(N iii] λ1750/N iv] λ1485). (c) log10(N iii] λ1750/O iii] λ1664) vs. log10(N iii] λ1750/Hδ). Star-forming galaxy models are shown for a metallicity log(Z/Z⊙) = −0.94, ξd = 0.3 for log(U) = −1, −2, and −3. The green lines show the increase of log10(N/O) from −1.8 to 0.7 and the fuchsia lines show the increase of hydrogen density from 102 to 106 cm−3. The observed line ratios are in best agreement with photoionization by a metal-poor stellar ionizing spectrum, but regardless of the ionization source, they conclusively require a significant enhancement in N/O in the ionized gas.
Download figure:
Standard image High-resolution imageNext, we consider the N iii]/N iv] ratio and He ii/Hδ in panel (b), both of which act as proxies for ionization. The He ii/Hδ recombination line ratio is effectively a direct probe of the ionizing power at 54.4 versus 13.6 eV assuming no stellar contributions (e.g., Senchyna et al. 2019), while the N iii]/N iv] ratio probes ionization conditions sensitive to the relative flux at the slightly lower-ionization potential of N iii (47.4 eV). While most of the stellar models prefer stronger N iii] than N iv], the near-unity ratio found in GN-z11 can be reproduced at high-ionization parameters of  . In addition, models with lower stellar metallicities also prefer lower N iii]/N iv] reflecting their harder ionizing spectra. We compute additional models with the stellar metallicity decoupled from the ISM metallicity (simulating expected enhancements in α/Fe; e.g., Steidel et al. 2016; Strom et al. 2018; Senchyna et al. 2022) and find that these produce even lower ratios. Even without invoking this effect, the implied ionization parameter is not unreasonable. In a spherical geometry,
  (e.g., Charlot & Longhetti 2001). Since 〈U〉 is proportional to
  , the high-density conditions we infer from the N iv] doublet may help explain why it is so prominent relative to N iii].
These low values of N iii]/N iv] are also consistent with the ionization conditions produced by AGN and shocks. However, the upper limit on He ii is constraining in this case, as pointed out by B23. Though it is compatible with the values predicted by the stellar models and even the discrepantly strong He ii emission routinely observed in local metal-poor star-forming galaxies (e.g., Shirazi & Brinchmann 2012; Senchyna et al. 2020; Berg et al. 2021), it is lower than the extremely high values predicted by the AGN and shock ionized models at the same N iii]/N iv]. Likewise, while less discriminating (see, e.g., Feltre et al. 2016), the lack of N v emission (ionization potential 77.5 eV) in the JWST spectrum argues against the much harder ionizing spectra these sources produce. While we cannot definitively rule out a contribution from AGN or shocks, we find better consistency with models dominated by star formation.
As we have seen, however, none of the models reproduce N iii]/(O iii], C iii]) at nominal N/O. We explore several of the other potential variables impacting this ratio in the final panel (c) of Figure 2. The starting point displayed is a 4 Myr constant star formation history model with a stellar and ISM metallicity of  we choose this value for Z as this is the best fit we infer from the line fitting we perform below (Section 3.2) for GN-z11. We adopt a nominal ξd
= 0.3 and plot ionization parameters of log10(〈U〉) = −1, −2 and −3.
we choose this value for Z as this is the best fit we infer from the line fitting we perform below (Section 3.2) for GN-z11. We adopt a nominal ξd
= 0.3 and plot ionization parameters of log10(〈U〉) = −1, −2 and −3.
First, we explore the impact of increasing the gas density on the UV–optical line emission. The fiducial model has nH = 102 cm−3, and we consider values increased up to the range inferred from the N iv] doublet ratio (Section 2). Increasing the density even up to 106 cm−3 does not strongly change these line ratios (Figure 2). The main effect of increasing the density above 104 cm−3 is the decrease of [O ii] λ3727 compared to the other lines since, for an electronic temperature of 104 K, the critical density for collisional de-excitation of O ii
 and
and  are 3.4 × 10³ and 1.5 × 10⁴, respectively (Osterbrock & Ferland 2006). These models with high density (106 cm−3) underpredict [O ii]/Hδ and [O ii]/[Ne iii] by more than an order of magnitude, even with the lowest value of the ionization parameter, further suggesting that the hydrogen density is not constant (Figure B2). This confirms that the high density inferred in the central part of the H ii region is not an adequate explanation alone for the elevated N iii] and N iv] emission compared to O iii] and C iii], especially since N iii] and C iii] are produced in the same zone of the H ii region.
Next, we explore whether the depletion of oxygen and carbon onto dust grains could bring the predicted line ratios into agreement on its own. We compute photoionization models with ξd ranging from 0.1 to an extreme 0.95 (∼3 × the solar value). The models are shown in Figure 3, with ξd increasing from 0.3 to 0.95. The highest value of ξd barely reaches the observed N iii]/O iii] (left panel) and N iii]/C iii] (right panel) ratios, as both carbon and oxygen are depleted onto dust grains but not nitrogen. N iii]/Hδ and N iv]/Hδ are also increased due to the increase in electronic temperature and the absorption of H-ionizing photons (left panel). However, the flux in the neon lines provides a crucial check on this scenario since neon is also non-refractory. At these high ξd values necessary to reproduce N iii]/O iii] and N iii]/Hδ, the predicted [Ne iii]/[O ii] (middle panel) and [Ne iii]/C iii] (right panel) are also strongly enhanced, and exceed the observed ratios by approximately an order of magnitude. Thus, depletion does not successfully reproduce all line ratios simultaneously and cannot explain the apparent enhancement in the nitrogen lines.
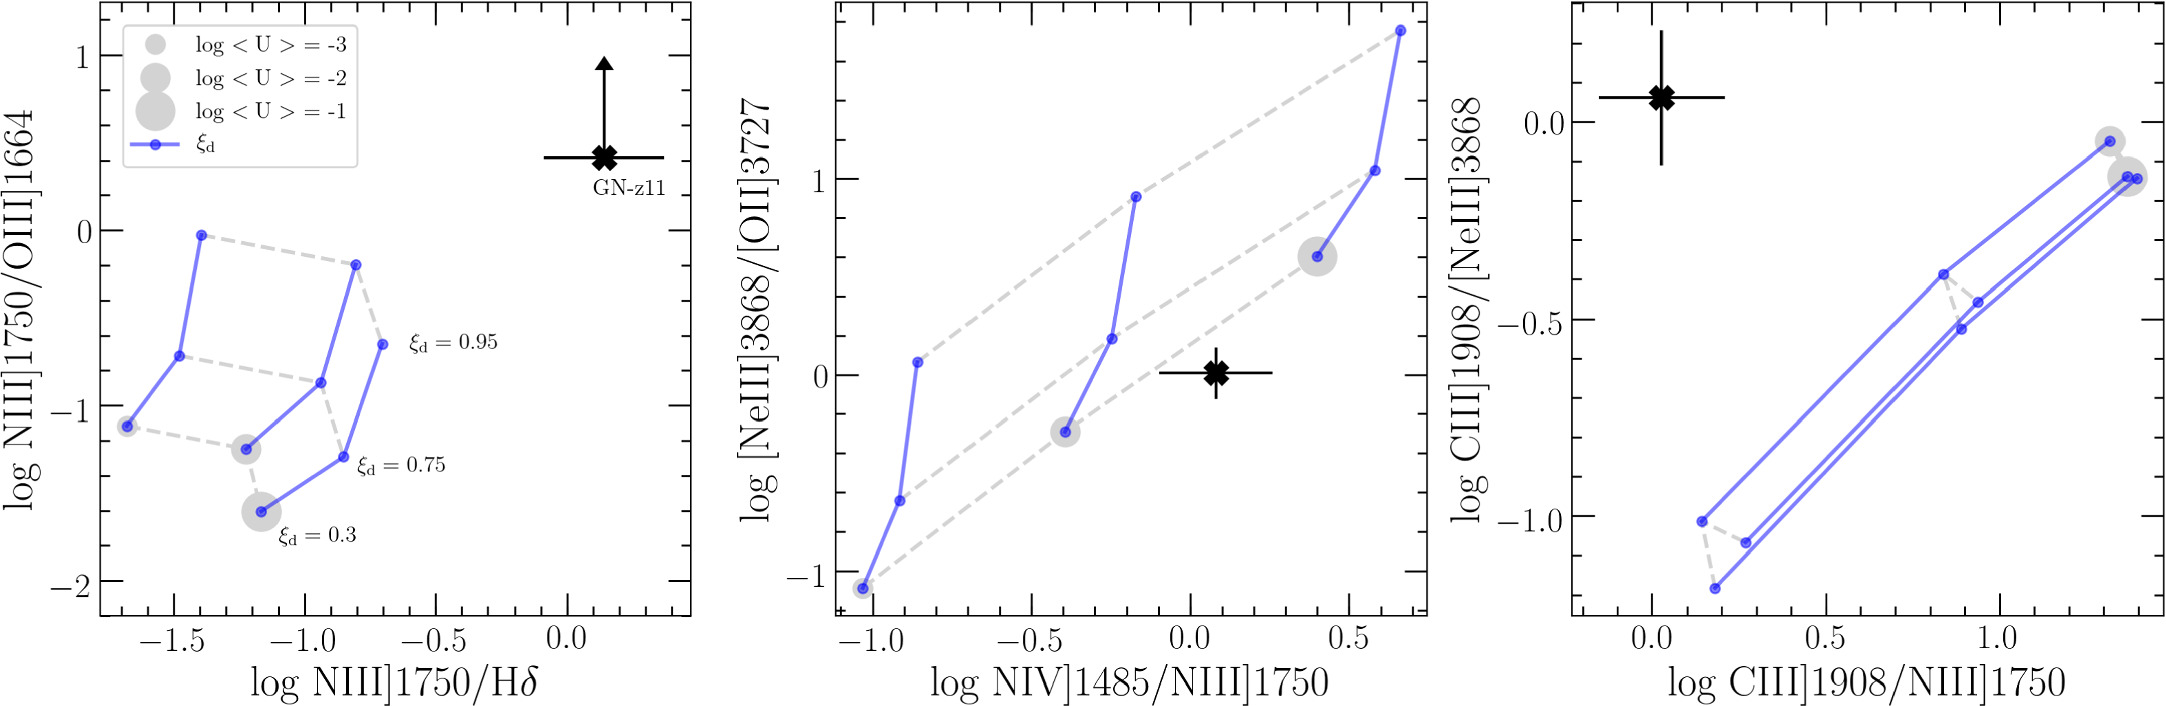
Figure 3. Comparison of GN-z11 (cross) line ratios with predictions from photoionization models showing the effect of increasing depletion onto dust grains, parameterized by the dust-to-metal mass ratio ξd. Star-forming galaxy models are shown for a metallicity log(Z/Z⊙) = −0.94, log10(N/O) = −1.8 for log(U) = −1, −2, and −3. The blue lines show the increase of ξd from 0.3 to 0.95. We highlight the effect of this change in ξd for three sets of line ratios: (a) log10(N iii] λ1750/O iii] λ1664) vs. log10(N iii] λ1750/Hδ); (b) log10([Ne iii] λ3868/[O ii] λ3727) vs. log10(N iv] λ1485/N iii] λ1750); and (c) log10(C iii] λ1908/[Ne iii] λ3868]) vs. log10(C iii] λ1908/N iii] λ1750). Though increased depletion can boost the observed ratio of the N to O lines, even the most extreme models presented here (at 3 × ξd,⊙) cannot reproduce the full set of observed line ratios.
Download figure:
Standard image High-resolution imageWith alternatives ruled out, we predict the impact of significantly enhanced nitrogen abundances on the UV–optical nebular lines. We compute and show models with N/O enhanced by up to (N/O)tot = 0.7 in panel (c) of Figure 2. This brings the modeled line ratios into good agreement with those observed, at super-solar nitrogen abundances in qualitative agreement with those estimated by C23.
3.2. Line Fitting with BEAGLE
Leveraging the grid of photoionization models we have computed and the other line ratios available for GN-z11, we proceed to directly fitting these lines with BEAGLE (Chevallard & Charlot 2016). We vary the metallicity within the range [−1.5, 0] in  , with the ISM metallicity set equal to the stellar metallicity,
  varies within [−4, − 1], the age of the stellar population within [5, 9] in
  assuming a constant star formation history for the present modeled episode and the stellar mass within [1, 15] in
  . We adopt an SMC attenuation curve (Pei 1992) and fit the V-band attenuation optical depth,
  , in the range 0–5. The total N/O is linked to total O/H through the relation:
We fit C within the range of [−0.25, 1.9]. C = −0.25 corresponds to the N/O versus the O/H relation of Gutkin et al. (2016), which gives  at Z = Z⊙ and C = 1.9 gives
  at Z = Z⊙. We fix ξd
to the solar value, 0.3, accounting for moderate dust depletion. C/O abundance follows the relation between
at Z = Z⊙. We fix ξd
to the solar value, 0.3, accounting for moderate dust depletion. C/O abundance follows the relation between  and
and  derived by Nicholls et al. (2017). We include the following observables in the fit: N iv] λ1485, the upper limit of O iii] λ1664
12
, N iii] λ1750, C iii] λ1908, [O ii] λ3727, [Ne iii] λ3868, [He i] λ3889, [Ne iii] λ3970 + H
derived by Nicholls et al. (2017). We include the following observables in the fit: N iv] λ1485, the upper limit of O iii] λ1664
12
, N iii] λ1750, C iii] λ1908, [O ii] λ3727, [Ne iii] λ3868, [He i] λ3889, [Ne iii] λ3970 + H , Hδ, Hγ and [O iii] λ4363, as well as EW(Hδ) and EW(Hγ). The grating flux values we fit for these lines are from B23 and a figure highlighting the resulting line comparison is presented in Appendix B.
This fit results in a total metallicity estimate of  and C =
  . This yields an estimated gas-phase abundances of
  and
and  , and in total (including the depleted material),
  and
and  (substantially super-solar, at [N/O] = +0.52; Caffau et al. 2008). The gas-phase O/H we measure is slightly below that inferred by C23, whose value of
  is however consistent with the total value we infer within our 1σ uncertainty. Our N/O inference is significantly more tightly constrained but broadly consistent with the lower end of the conservative range of
  estimated from a two-zone nebular model argument by C23. However, we note that our estimate of the gas-phase N/O is at the edge of the more stringent fiducial estimate of
  inferred by C23, and our constraint on total N/O is significantly lower, which we attribute to the more detailed accounting of nebular physics including depletion incorporated in our photoionization modeling approach.
We also find a young best-fit age of  in log10(age yr−1) corresponding to 3.7 Myr; and a large ionization parameter of
  . These quantitative inferences from the nebular line spectrum add further support to the emerging picture of a galaxy dominated by extremely dense conglomerations of massive stars, with low overall metallicity despite a remarkably strong enhancement in nitrogen.
In sum, our exploration of a wide range of ionization mechanisms and gas conditions confirm that the observed UV–optical emission lines in GN-z11 require a substantially super-solar N/O, a conclusion we demonstrate is remarkably robust to assumptions about non-stellar ionizing agents, extremely high gas densities, and dust depletion of oxygen. The N iv] emission is strong relative to N iii] but reproducible by a metal-poor ionizing spectrum under high-density conditions. While we cannot definitively rule out other ionizing sources, we do not find any distinct evidence for AGN or shocks among the nebular line constraints.
3.3. On the Possible Presence of an AGN in GN-z11
A crucial point to reemphasize here is that our photoionization model fitting results rest upon an assumption that the nebular emission in GN-z11 is dominated by star formation. While we make a comparison to the narrow-line AGN models above and do not find clear evidence for their strong contribution, we cannot rule out a contribution from AGN, and in particular, a contribution from a broad-line region around a relatively low mass of ∼106 M⊙ black hole as argued by Maiolino et al. (2024), during refereeing of this manuscript, based upon follow-up spectroscopy. The key pieces of evidence presented by Maiolino et al. (2024) are (1) electron densities inferred from a higher resolution and an S/N N iii] profile in excess of 1010 cm−3 (see the ≳105–106 range implied by N iv]; Section 2); and (2) a detection of [Ne iv]λ2424. Additional clues presented are a strong C iv λ λ1548, 1550 P Cygni profile, and fluorescent C ii* λ1335 emission.
A detailed exploration of this new data and these two scenarios is beyond the scope of this paper. Clearly, yet deeper and higher-resolution observations (Maiolino et al. 2024 employ the medium-resolution NIRSpec gratings which provide R ∼ 2000) where possible will be key to further unraveling the possible contributions to UV nebular emission in GN-z11 and other similar galaxies. In particular, such data may provide revealing constraints on other high-ionization lines commonly encountered in AGN and resonant features powered in massive stellar winds or larger-scale outflows, and further information about the kinematic (and potentially spatial) information encoded in the line profiles for which broadening is suggested in the current data. A hint of the potential (and challenges) of such data is provided by the deep study of the nearby system Mrk 996 discussed below (Section 4.2), in which line broadening at the ∼400 km s−1 level is detected in nitrogen-enhanced gas with constraining limits placed on an accreting black hole (James et al. 2009; Georgakakis et al. 2011; Telles et al. 2014).
Further modeling accounting more fully for non-stellar emission will be crucial for interpreting deeper spectra of GN-z11. However, it is interesting to note that some analysis of apparently nitrogen-dominated spectra has been performed in the literature for AGN as well. In particular, consider the nitrogen-loud quasars, which are defined by their prominent emission in N iii], N iv], and N v; these objects are the closest empirical comparison point to GN-z11 if the spectrum is assumed to be AGN powered (as pointed out below in Section 4.3 and by Maiolino et al. 2024). First, it is worth pointing out that these objects are rare; Jiang et al. (2008) estimate from a thorough search of the Sloan Digital Sky Survey (SDSS) DR5 that even with a conservative definition (> 3 Å detection of either N iv] or N iii]) that these objects comprise only ∼1.1% of the quasar sample. Notably, detailed analyses of these objects indicate that the prominence of these lines likely reflects a large overabundance of nitrogen (e.g., Baldwin et al. 2003; Jiang et al. 2008; Matsuoka et al. 2017, though see also Batra & Baldwin 2014). While quantitative constraints await further modeling, this literature suggests that even if the nitrogen emission in GN-z11 is instead AGN powered, it likely reflects an elevated nitrogen abundance in the broad-line region gas; we discuss this further in Section 5.
4. Insight from Local and Lower-redshift Samples
The N iv] and N iii] transitions so prominent in GN-z11 are uncommonly detected in star-forming galaxies at high redshift. However, they are not entirely without precedent among local metal-poor galaxy samples. Comparisons to the local Universe can provide helpful reference points for understanding spectral properties in the distant Universe, even when exact matches cannot necessarily be found (see, for instance, the substantial insight gained on C iii] emission glimpsed in the reionization era pre-JWST; e.g., Rigby et al. 2017; Jaskot & Ravindranath 2016; Senchyna et al. 2017, 2019).
We perform a search for these emission lines in nearby star-forming galaxies observed in the ultraviolet. A growing database of such spectra now exists especially from recent programs leveraging the sensitivity of HST/COS, targeting galaxies approaching the metallicities and stellar population ages likely to be encountered at high redshifts, including CLASSY (Berg et al. 2022a, 2022b; James et al. 2022).
We first identify and examine N iv] emitters in local star-forming samples in Section 4.1. Then, in Section 4.2, we explore a unique galaxy in the local Universe, which powers a remarkably similar UV spectrum. Finally, in Section 4.3 we briefly summarize and discuss galaxies with prominent UV nitrogen lines at other redshifts of z < 10.
4.1. Local N iv] Emitters
We search for N iv] detections in public COS UV spectra, focusing in particular on galaxies with medium-resolution grating data sufficient to resolve the N iv] components and ensure confident line identifications in the low signal-to-noise ratio (S/N) regime. We find detections of N iv] λ λ1483, 1486 emission in at least eight systems across the samples presented by Berg et al. (2022b) and Senchyna et al. (2022). We plot the detections for a representative subset in Figure 4.
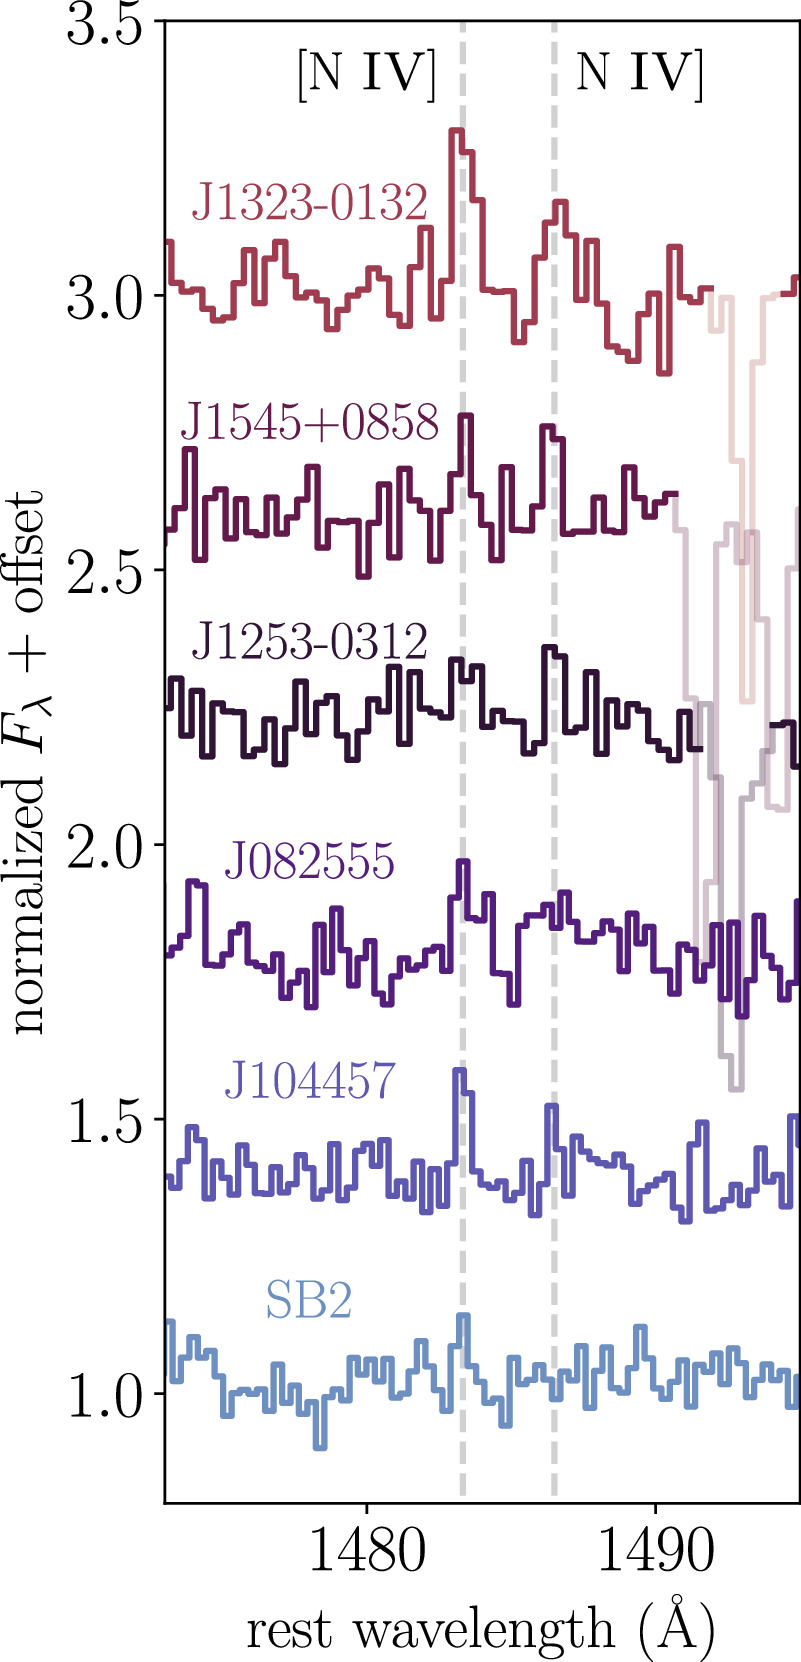
Figure 4. The N iv] doublet is encountered in deep UV spectra of local metal-poor star-forming galaxies, especially at low gas-phase metallicities 12 + logO/H < 8.0 and young stellar ages. A selection of HST/COS detections of the doublet from the samples assembled by Senchyna et al. (2022) and Berg et al. (2022b) are plotted here, with Milky Way and ISM absorption lines masked where present. The line ratios are consistent with more prosaic electron densities (range plotted in Figure 1) than GN-z11, and are substantially less prominent than in GN-z11, consistent with the low nitrogen abundances in these local systems.
Download figure:
Standard image High-resolution imageThe galaxies powering nebular N iv] emission identified here tend to be metal-poor. Of the six found in the CLASSY sample (see also Mingozzi et al. 2022), all fall at  (approximately 20% solar), and extend to the lowest metallicities in that sample (e.g., J104457, at 12 + logO/H = 7.45). While limited by the sample size and the nonuniform depth of the parent samples of UV spectra, this suggests an empirical association between metal-poor massive stars and N iv] emission locally.
This association with low-metallicity stellar Z/Z⊙ < 0.2 stellar populations is evocative of that identified in C iv emission (Senchyna et al. 2019, 2022). Both N iv and C iv have very similar ionization potentials (∼47 eV), just below the He+-ionizing edge. Indeed, four of the six CLASSY N iv] emitters are also found to power C iv in nebular emission. To this sample, we add two additional N iv] and C iv emitters from the sample of Senchyna et al. (2022), for a detection rate of N iv] alongside C iv of half in this sample. This suggests that these lines share a common ionizing source and association with young metal-poor stellar populations, but that other factors, likely including both C iv resonant scattering (e.g., Senchyna et al. 2022) and the N/O abundance and concentration of star formation (Section 3) modulate this association.
We also note for completeness detections of similar equivalent width N iv] λ1486 with weak [N iv] λ1483 in several of the Wolf–Rayet (W-R) galaxies presented by Senchyna et al. (2021). At first glance, this suggests an occurrence at much higher metallicity than just discussed, and potentially under density conditions approaching those in GN-z11. However, N iv] (and at some temperatures N iii] as well; e.g., Crowther & Smith 1997) is also seen powered directly in W-R galaxy spectra and similar stellar atmospheres themselves (e.g., Martins et al. 2009; Hainich et al. 2014). Indeed, the detection of N iv λ1719 in P Cygni in the same W-R galaxy spectra at a comparable strength confirms that we are likely viewing wind emission in N iv]. We note however that we do not consider wind emission a plausible explanation for the far more prominent emission in GN-z11, where no clear stellar wind signatures are evident (and in particular, comparable strength features in at least He ii, N v, and N iv would be demanded).
While we cannot rule out other ionizing contributions, the close association between C iv, N iv], and metal-poor star-forming environments is suggestive of an association with the hard ionizing continua powered by low-metallicity stellar populations locally. Broadly, the line fluxes we derive are compatible with the photoionization model predictions for star-forming galaxies with nominal N/O presented in Section 3. The detection statistics discussed above suggest that N iv] emission may be (like C iv) an indicator for young metal-poor stellar populations in the absence of non-stellar ionizing sources.
However, the doublet ratios and thus inferred densities in these local N iv] emitters differ systematically from that measured in GN-z11. We fit this doublet ratio in the local blue compact dwarf spectra plotted in Figure 4 following a similar procedure to that outlined in Section 2, and find doublet ratios of F1483/F1486 ranging from 0.95 up to values consistent within the uncertainties with the high-density limit of ∼1.5. This suggests densities in the N iv]-emitting gas closer to 104–105 cm−3 or below in the N iv]-emitting gas among these local galaxies (Figure 1), as found by Mingozzi et al. (2022) in the CLASSY subset.
The cause of these systematically lower inferred nebular densities with respect to GN-z11 (≳105–106 cm−3) may reside in the significantly different global densities of star formation probed in these environments. Even in the intense local C
iv emitters, dominated by young star formation in UV-compact regions, we are viewing populations characterized by both relatively low absolute SFRs within the COS aperture ( to −0.5) and moderate SFR surface densities of ΣSFR ≲ 10 M⊙
yr−1 kpc−2 (estimated from photometric parameters in Senchyna et al. 2022). These absolute SFRs are approximately 2 orders of magnitude below that inferred in GN-z11 (as expected given the very different mass scales under consideration), and while they are closer in density, their SFR surface densities remain greater than or equal to four times below the unresolved lower limit placed upon GN-z11 (Section 1). This suggests that the star formation mode that characterizes GN-z11 is substantially more concentrated and potentially highly clustered than even these local blue compact dwarfs.
to −0.5) and moderate SFR surface densities of ΣSFR ≲ 10 M⊙
yr−1 kpc−2 (estimated from photometric parameters in Senchyna et al. 2022). These absolute SFRs are approximately 2 orders of magnitude below that inferred in GN-z11 (as expected given the very different mass scales under consideration), and while they are closer in density, their SFR surface densities remain greater than or equal to four times below the unresolved lower limit placed upon GN-z11 (Section 1). This suggests that the star formation mode that characterizes GN-z11 is substantially more concentrated and potentially highly clustered than even these local blue compact dwarfs.
The other key difference with respect to GN-z11 is the relative strength of this N iv] emission. In the local metal-poor star-forming systems we analyze here, we measure combined equivalent widths for the N iv] doublet ranging from 0.1–0.6 Å, substantially less prominent than the λ1486 detection at ∼10 Å in GN-z11. Unfortunately, we lack strong constraints on the N iii] line for these systems; none are detected, but the declining throughput of the COS/G160M grating at those longer wavelengths prevents us from ruling out N iii] at a comparable ≲1 Å equivalent width to N iv]. But the reasonable agreement between the N iv] line fluxes relative to O iii] measured in these systems and predicted in Section 3 without nitrogen enrichment strongly suggests that the root cause of this offset lies in their known lower nitrogen abundances (e.g., Berg et al. 2021).
These local detection statistics indicate that N iv] is associated with young stellar populations at low metallicities (Z/Z⊙ ≲ 0.2). However, the doublet ratios and equivalent widths measured among these local systems differ significantly from those reported in GN-z11. Broadly, this lends further credence to the idea that GN-z11 is host to a remarkably dense and highly nitrogen-enriched gas that is extremely rare even in galaxies dominated by recent metal-poor star formation nearby.
4.2. A Near-analog for GN-z11: Mrk 996
The local N iv emitters discussed above are missing two key features that distinguish GN-z11: the combination of very high ∼106 cm−3 nebular electron densities and highly elevated N/O sufficient to boost the UV nitrogen lines. However, a further review of the literature and local samples does reveal one nearby galaxy with attributes remarkably similar to those of GN-z11. The UV spectrum of Mrk 996 stands out among the CLASSY sample of local star-forming galaxies with its extremely prominent N iii] emission complex, the only example therein of a clear detection of this complex (Mingozzi et al. 2022). The equivalent width of this N iii] complex is 10 Å, equal to that reported in GN-z11 by B23 (Figure 5). The scale of this star-forming complex is substantially smaller than GN-z11, with an SFR an order of magnitude smaller (James et al. 2009); however, an investigation of the conditions that support such similar N iii] emission is instructive.
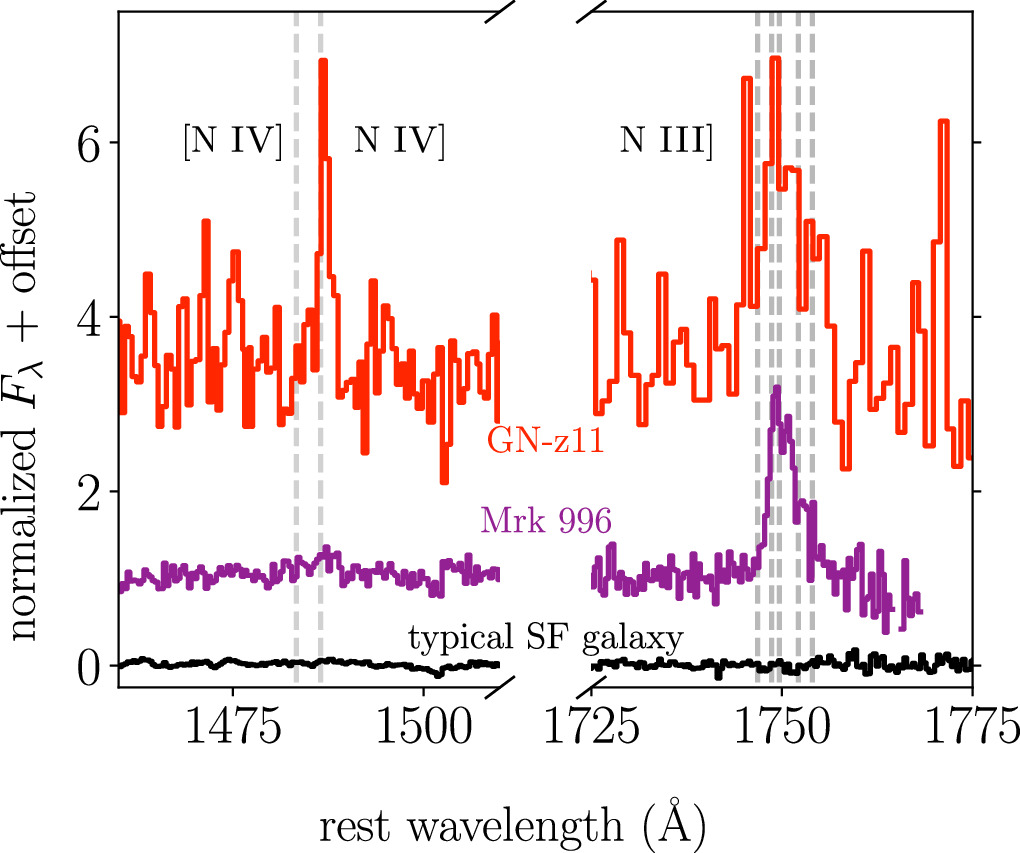
Figure 5. The HST/COS UV spectrum of the local blue compact dwarf galaxy Mrk 996 (Berg et al. 2022b) reveals N iii] emission strikingly similar to that observed in GN-z11. For reference, we also include the median stack of the normalized spectra of the full CLASSY sample (Berg et al. 2022a, 2022b; James et al. 2022) in black. A similar N/O overabundance and high central electron density is inferred in Mrk 996, and attributed to the presence of an unusual concentration of W-R stars with N-rich winds. This demonstrates that similar spectral features can be powered by massive stars embedded in their own dense CNO-processed ejecta. The addition of N iv] emission and lack of strong W-R features in GN-z11 further suggests that though they appear to power comparable N iii], GN-z11 may be powered by lower-metallicity massive star populations.
Download figure:
Standard image High-resolution imageWhile N iii] emission in the two systems is strikingly similar, Mrk 996 does not power clearly detectable N iv] emission. A hint of possible emission is evident in the λ1486 component (Figure 5), but a comparable line EW is clearly ruled out. It is possible that the equivalent width of N iv] might be suppressed in the COS aperture given the remarkably compact region in which the highest densities are inferred in the optical (James et al. 2009), but this would not explain the lower integrated N iv]/N iii] ratio. However, we have already demonstrated that this line ratio can vary by nearly 2 orders of magnitude with varying metallicity and ionization parameters over a reasonable range (Section 3). Likewise, the detection rate of N iv] supports an association with ionizing radiation fields encountered at particularly low stellar metallicities (Section 4.1). The prominent N iv] λ1486 accompanying N iii] in GN-z11 could then be attributed to a higher concentration of potentially more metal-poor ionizing stars than Mrk 996.
Like GN-z11, Mrk 996 is a clear outlier in its prominent N iii] emission from other star-forming galaxies, which might otherwise appear qualitatively similar. An explanation for this in Mrk 996 is clearly revealed by multiwavelength studies. The massive stars in Mrk 996 are unusually concentrated for a blue compact dwarf even in space-based optical imaging, with the star formation occurring almost entirely within an unresolved r ≲ 160 pc central region (Thuan et al. 1996). While the lack of N iv] emission prevents a similar ne measurement, a combination of an anomalously high Hα/Hβ ratio, peculiar O iii and He i line ratios, and measurements of two density-sensitive doublets of [Fe iii] in the optical all suggest core central densities of ne ≃ 106 cm−3 or slightly higher (Thuan et al. 1996; James et al. 2009; Telles et al. 2014)—entirely compatible with the high density we infer in the highly ionized gas of GN-z11. The core region is clearly nitrogen enhanced relative to the surrounding gas (for which they estimate logN/O = −1.5): with a super-solar logN/O = −0.15 inferred by James et al. (2009) and Telles et al. (2014). This extreme overabundance is also in good agreement with that inferred from the UV nitrogen and oxygen lines in GN-z11. The oxygen abundance is less clear; estimates for 12 + logO/H range from 7.9 (near one-fifth solar metallicity; Telles et al. 2014) to ≳8.3 (half solar; James et al. 2009) using different approaches to modeling the kinematically complex line emission in this galaxy. A somewhat higher stellar metallicity of Z/Z⊙ ≳ 0.2 is suggested by the prominence of stellar wind features in the UV–optical, and again the correspondingly softer radiation field would also naturally explain the lack of N iv] emission.
In any case, the picture assembled in Mrk 996 also points to a clear origin of the extremely dense, nitrogen-enriched gas at the core of the cluster. The signatures of W-R winds are clear in the optical spectra, entirely concentrated in the dense nuclear cluster. Even without correcting the intrinsic wind line luminosities for the potentially low stellar metallicity of Mrk 996, Telles et al. (2014) estimate an extremely high ratio of N(W-R)/N(O + W-R) = 0.19; suggesting a remarkably high stellar density of ∼2600 WNL stars and ∼400 WC stars over an area of only 4.6 × 10⁴ pc2 (James et al. 2009). This association strongly suggests that in Mrk 996 we are observing the highly nitrogen-enriched ejecta of these massive stars.
Mrk 996 provides a demonstration that photoionization of highly N-enriched stellar ejecta in a dense stellar cluster can produce UV spectral features similar to those glimpsed in GN-z11. Unfortunately, Mrk 996 is essentially entirely unique among blue compact dwarfs—no other star-forming galaxy with such prominent localized and high-density W-R enrichment or a similar UV spectrum has been identified in the local Universe. Given that the peculiar N/O enhancement and electron density of Mrk 996 can be identified from fairly shallow optical spectroscopy and that SDSS and other spectroscopic surveys have not identified any similar objects (e.g., Pilyugin et al. 2012b), Mrk 996 appears to be the exception that proves the rule: the peculiar set of processes occurring in GN-z11 are likely exceptionally rare, short-lived, or absent at z ∼ 0.
4.3. Other High-z Reference Points
Before returning to focus on GN-z11 in the following discussion in Section 5, we briefly summarize here other galaxies beyond the nearby ≲200 Mpc Universe with reported N iii] or N iv] emission for comparison.
First, a super-star cluster complex in the Sunburst Arc stands out as among the most instructive comparison points. We return to discuss the implications of a detailed study of this system (Pascale et al. 2023) in Section 5, but note here that it powers an N iii] complex nearly as strong relative to the other UV lines as observed in GN-z11.
These transitions have been noted in several other apparently star-forming galaxies at intermediate to high redshifts. The Lynx arc powers a spectrum with prominent N iv] alongside similarly strong C iv and weaker N iii] ( ? ), which they argue are powered by star formation; notably, the N iv] ratio is not in the high-density limit as observed for GN-z11. At higher redshift, Raiter et al. (2010) and Vanzella et al. (2010) identify a spectrum dominated by N iv] apparently in the high-density limit in a z = 5.56 Lyα emitter with no other rest-UV metal lines; this object was later confirmed to host an AGN based upon very broad optical line components and prominent He ii with JWST (Übler et al. 2023). McGreer et al. (2018) report the detection of N iv] in the high-density limit and possible nebular C iv in a lensed z = 5.42 system, which they argue is best reproduced by star formation. This system is the closest in SFR and mass scale to GN-z11 among these systems; though uncertain due to lensing, it is plausibly forming stars at 10–100 M⊙ yr−1.
Finally, N iv] emission is also detected among some AGN. Hainline et al. (2011) find a detection of N iv] at lower flux than N v and C iv in a stack of UV-selected AGN at z ∼ 2–3; The strength of N iv] in a sample of z ∼ 2.5 radio galaxies leads Humphrey et al. (2008) to invoke a combination of AGN and shock ionization to explain their presence. N iv] emission is not entirely uncommon in deep spectra of QSOs, and has been leveraged even as a metallicity indicator (e.g., Hamann & Ferland 1999). However, a class of rare quasar has been defined by the prominence of broad emission in N iv], N iii], and N v: the nitrogen-loud quasars (e.g., Glikman et al. 2007; Batra & Baldwin 2014; Matsuoka et al. 2017). Interestingly, Matsuoka et al. (2017) argue that the spectra of these objects likely reflect substantial nitrogen enrichment, plausibly related to intense nuclear star formation (see also Section 3.3).
5. Discussion and Summary: GN-z11 as a Potential Globular Cluster Precursor
Our reappraisal of the peculiar rest-UV spectrum of GN-z11 reveals several key clues about the system. Regardless of the ionization mechanism, the N iv] and N iii] emission in GN-z11 cannot be reproduced without the presence of very dense (ne
≳ 105 cm−3; Section 2) and highly nitrogen enriched ( , assuming nebular emission dominated by star formation, though likely elevated even if an AGN is involved; Section 3) gas. A close comparison to the local compendium of UV star-forming galaxy spectra suggests that the relative strength of N iv] in particular is consistent with ionizing spectra of particularly low-metallicity (Z/Z⊙ < 0.2) and very young stellar populations (Section 4). However, the densities inferred from N iv] in these local systems are systematically lower than that implied in GN-z11, suggesting that GN-z11 might be undergoing a far more dense mode of star formation, which is extremely rare today. Close similarities with a unique high-density star-forming complex in Mrk 996 are noted, which support the idea that the peculiar properties of GN-z11 may be related to conditions of extremely high-density massive star formation. A natural question that then arises is whether any record of such an event might be recorded in the local Universe.
The nitrogen enrichment is a crucial clue in contextualizing GN-z11. The major site of nitrogen production in the Universe is in massive stellar interiors fusing hydrogen into helium following the CNO process. This process utilizes carbon, nitrogen, and oxygen isotopes as catalysts, and is bottlenecked by the slow proton-capture step 14N(p, γ)15O, thus, efficiently converting C and O to N as a byproduct of hydrogen fusion. In contrast to the α-elements carbon and oxygen, substantial nitrogen is not naturally expected as a generic product of any class of supernovae, including primordial Population III models (as explored by C23). Instead, the ISM is enriched with nitrogen primarily through processes that can eject CNO-processed material from stellar interiors during their lifetime—including the winds of W-R stars and similar stars, where the N-rich nuclear-processed core layers of a massive star have been exposed through wind or binary mass stripping. Indeed, galaxies in the local Universe presently hosting large populations of W-R stars commonly show enhancements in N/O, though generally of a much smaller scale than in Mrk 996 and not always in a one-to-one relationship (e.g., Pagel et al. 1986; Brinchmann et al. 2008a; James et al. 2013; Kumari et al. 2018).
In the local Universe, metal-poor stellar populations with evidence for initial abundances enriched by CNO processing are rare in the field and open clusters (e.g., Magrini et al. 2018), but they are a defining feature of globular clusters (e.g., Gratton et al. 2004). If stars form or are currently forming from ISM material in GN-z11 with the abundance pattern we are glimpsing in the ionized gas phase, they will closely resemble in N and O the enriched populations we see today in nearby globular clusters. To illustrate this, we compare the gas phase and total N/O we infer in GN-z11 with measurements reported for stars in several globular clusters shown in Figure 6. In particular, we highlight in Figure 6 abundances of faint dwarf main-sequence turn-off stars in the nearby globular cluster NGC 6752 from Gratton et al. (2001) and Carretta et al. (2005), one of only a handful of globular clusters for which such measurements have been made and both N and O measured confidently (see also results for the higher-metallicity 47 Tucanae: Briley et al. 2004; Carretta et al. 2005). These faint unevolved stars are of particularly significant value because no mixing or dredge-up is expected to yet modulate their photospheric (C)NO abundances, making them particularly good tracers of the natal composition of the cluster populations. For comparison, we also plot averaged abundance results for the five populations (Milone et al. 2015) identified in the well-studied cluster NGC 2808 from Carlos et al. (2023), and results from a more standard RGB spectroscopic analysis in NGC 1851 from Yong et al. (2015). In the N/O versus O/H space shown in Figure 6, the stars in each of these clusters form distinct spears due to their well-established N-O anticorrelation at fixed Fe/H from the relatively O-rich and N-poor first population stars in the bottom right to their maximally N-enriched O-poor second population extending to the upper left.

Figure 6. The O/H-N/O abundance space occupied by GN-z11 is in good agreement with the patterns observed in present-day globular clusters. To illustrate, we compare constraints on GN-z11 from both C23 (red box) and our photoionization modeling results (red symbols, error bars partially covered; Section 3) to abundances of stars in the globular clusters NGC 6752 (specifically faint main-sequence turn-off stars; Gratton et al. 2001; Carretta et al. 2005), NGC 2808 (population averages; Carlos et al. 2023), and NGC 1851 (Yong et al. 2015). We also plot the abundances of local H ii regions sampled by Pilyugin et al. (2012a). The location of GN-z11 close to the locus of globular cluster stars at systematically lower O/H and higher N/O relative to local star-forming systems suggests that we may be viewing (with some dilution by other gas or different star-forming regions) the dense N-rich ejecta from early stellar populations embedded in globular cluster precursors in GN-z11.
Download figure:
Standard image High-resolution imageA comparison of these stellar abundances to our results for GN-z11 in Figure 6 makes it clear that GN-z11 has integrated N and O abundances that fall much closer to those typical of metal-poor globular clusters than to the locus of local H ii regions in Pilyugin et al. (2012a). This contrasts with the vast majority of star-forming galaxies, which generally are found to overlap with the positively correlated sequence of N/O with O/H (and generally Fe/H) exhibited also in the nearby H ii regions (see also Berg et al. 2020; C23; Charbonnel et al. 2023).
This interpretation has significant potential implications for the origin of globular clusters. First, our results clearly establish the basic plausibility of the natal enrichment picture for the second generation in the most ancient globular clusters, as we are viewing in situ a quantity of N/O-enhanced material more than sufficient to form a globular cluster population. To estimate the total mass of material involved, we perform order-of-magnitude calculations in Appendix A that establish that the mass of gas in the ionized phase with integrated abundances reflecting CNO processing exceeds 107 M⊙ (assuming the nebular emission is dominated by star formation). Even without accounting for enriched material in other phases and allowing for an extremely low star formation conversion efficiency, this easily represents enough material to form massive globular clusters.
Indeed, the scale of this mode of star formation is strikingly large and early. The possible contribution of an AGN to the light could scale down the mass in stars required considerably (e.g., Maiolino et al. 2024), but relying on stellar mass estimates from photometric fitting assuming star formation dominates the continuum (Tacchella et al. 2023), we may be viewing upwards of 108 M⊙ of stars built-up already in what appears to be a system currently dominated by globular cluster-like gas abundances, packed into an extremely compact <200 pc region. Comparing the observed intrinsic luminosity of GN-z11 (MUV = −21.6; Tacchella et al. 2023) to model predictions of very young <5.5 Myr globular clusters in formation from Boylan-Kolchin (2018) suggests GN-z11 is an order of magnitude more luminous than expected for the brightest individual clusters based upon their present-day stellar mass; though interestingly, a ≳10 × more massive precursor is qualitatively consistent with many models invoked to explain the observed abundance discrepancies (e.g., Conroy 2012). We note that the predictions for related but more massive objects such as ultracompact dwarfs or massive globular clusters with a top-heavy initial mass function are more readily in line with the observed brightness (e.g., Jeřábková et al. 2017). The early time before reionization at which this object is caught is also interesting in the context of predictions for the formation channels of globular clusters, and motivates the importance of searching for candidate precursors spectroscopically at other redshifts (e.g., Bromm & Clarke 2002; El-Badry et al. 2019).
It is instructive to compare GN-z11 to another well-studied high-redshift system, but one whose detailed investigation is aided by its lower redshift and strong gravitational lensing: the Sunburst Arc at z = 2.4. The Sunburst is host to a compact young super-star cluster (∼3 Myr; Chisholm et al. 2019; Vanzella et al. 2020, and indications of a very high overall cluster formation efficiency: Vanzella et al. 2022), which is leaking Lyman continuum radiation (Rivera-Thorsen et al. 2019), and whose UV spectrum bears some similarity to GN-z11 and Mrk 996. In particular, strong N iii] λ1750 emission is apparent, though at a somewhat lower flux relative to O iii] than in these systems (N iii] λ1750/O iii] λ
λ1661, 1666 near 0.9, see >2 in GN-z11 and Mrk 996; Figure 2 and Pascale et al. 2023). Pascale et al. (2023) conclude from a detailed analysis (leveraging strong constraints on the hydrogen column density and cluster radius unavailable for GN-z11) that this cluster is host to ≳105
M⊙ of dense, highly nitrogen enriched (inferring  comparable to our gas-phase measurement in GN-z11) material that is likely capable of forming a globular cluster. The similarity of GN-z11 to spectra of the Sunburst cluster (and Mrk 996) is particularly striking given that GN-z11 may be at least an order of magnitude more massive, in both the photometrically estimated stellar mass and inferred quantity of nitrogen-enriched gas involved.
It is important to note that though GN-z11 clearly overlaps with globular cluster population abundance sequences, its integrated N/O value is still less extreme than in many second-population globular cluster stars (Figure 6). This is not necessarily surprising given both the apparent mass scale under consideration and the likely complex gas processing history responsible for generating the observed spectrum. In the scenario we present, the moderate position of GN-z11 in integrated N/O could be due to some combination of dilution of CNO-processed gas with other material, or by dilution of light from ionized and highly enriched globular cluster progenitor gas by other star-forming regions with more typical N/O, resulting in a more moderate integrated abundance estimate. Distinguishing these scenarios and determining confidently whether the gas abundances we infer directly correspond to the abundances of forming or to be formed stars in GN-z11 is challenging with the presently available data. Even with some dilution, however, the brightness and mass scales at play suggest we are viewing both a highly clustered and very large star formation event. However, the actual number of potential globular cluster precursors likely to be involved is unclear, as is the stage of their formation. It is possible that a small number of initially very massive clusters may have been caught during formation, after which substantial stellar mass may be lost to dynamical stripping and other evaporation mechanisms, as has been suggested as a solution to certain abundance modeling issues in globular clusters (e.g., Decressin et al. 2007). Regardless, our results strongly suggest that we are viewing a system within ∼400 Myr of the Big Bang whose UV and ionizing light is dominated by stars forming under intense globular cluster-like conditions.
The exact origin of the nuclear-processed material that enriched present-day globular clusters has long been the focus of debate (e.g., Bastian & Lardo 2018). One of the long-standing candidates is the wind of intermediate-mass ∼4–7 M⊙ asymptotic giant branch (AGB) stars (e.g., Ventura & D'Antona 2009). However, the characteristic timescales for such relatively low-mass stars to evolve off the main sequence and traverse the AGB phase are ∼40–100 Myr. As pointed out by C23, this is at odds with the apparently rising star formation history of GN-z11 situated at just ∼400 Myr after the Big Bang and its uncertain but young light-weighted age estimate of <20 Myr (though see also D'Antona et al. 2023). While we cannot rule such sources out, capturing already extremely elevated N/O associated with a very young and massive burst of high-density star formation is suggestive of a prompt enrichment mechanism.
The spectrum of GN-z11 also casts some light on other candidate mechanisms for globular cluster enrichment. The dense winds powered by hot massive stars would be expected to produce prominent signatures in UV lines, especially resonant N v λ λ1238, 1240 and C iv λ λ1548, 1550 lines but also lines like He ii λ1640, which are enhanced in massive stars near the Eddington limit even at lower metallicities (e.g., Senchyna et al. 2021; Martins & Palacios 2022). While the JWST spectra are limited in S/N and resolution, very strong P Cygni profiles in these transitions appear to be ruled out by the prism data, whose overall morphology is more consistent with the relatively blank continuum observed at stellar metallicities of Z/Z⊙ < 0.2 where metal line-driven winds are substantially weakened (e.g., Senchyna et al. 2017), which is consistent with the low stellar metallicity suggested by both the gas-phase abundances and N iv] detection (though note the C iv P Cygni profile detected in follow-up data; Maiolino et al. 2024). Thus, it is unlikely that this material in GN-z11 is released by radiatively driven winds of massive W-R stars, as appears to be the case in Mrk 996 (Section 4.2).
The combination of apparently prompt enrichment without luminous massive star wind features instead points us to other mechanisms by which CNO-processed material might be ejected by massive stars. One solution invokes supermassive stars (∼103–105 M⊙) formed by runaway collisions, which are predicted to produce copious amounts of nuclear-processed material, while remaining cool and UV faint (e.g., Gieles et al. 2018; Martins et al. 2020; Charbonnel et al. 2023). However, other possibilities relying only on stars of a more prosaic mass range are also possible. Even in present-day open clusters, the majority of massive stars are not just in binaries but are expected to interact and undergo mass transfer or even merge with a companion (e.g., Sana et al. 2012). As explored by de Mink et al. (2009), this mass transfer is likely to often be highly nonconservative and eject substantial amounts of nuclear-processed material to the cluster medium, readily reproducing globular cluster abundance patterns in broad strokes. This material has the advantage of being ejected at much slower velocities than typical radiatively driven stellar winds, enhancing the likelihood of it staying bound to the cluster. Additionally, this mechanism readily explains the enhancement in these yields in extremely dense early Universe star formation conditions, as dynamical interactions with both cluster gas and other stars will form and harden close binaries and enhance the likelihood and rate of interactions extremely efficiently (in addition to other processes with similar products such as stellar collisions; e.g., Fabrycky & Tremaine 2007; de Mink et al. 2009; Sills & Glebbeek 2010; de Mink et al. 2014). This explanation may also help alleviate a key timescale problem faced by a solution invoking canonical massive W-R stars; in contrast to the relatively precisely timed production of self-stripped luminous W-R stars, material may be ejected by binary interaction for stars of the full range of masses both before and after the timescale for pollution (and/or gas clearing) by the onset of Type II supernovae.
While only limited conclusions can be drawn from a single object, it is possible that GN-z11 may not be entirely unique in the high-redshift Universe. While their nature likely varies, some other high-redshift detections of prominent N iii] and N iv] emission lines beyond GN-z11 and the Sunburst Arc (Section 4.3) may hint at similar conditions. If globular clusters are a major source of UV light at z > 6 (e.g., Boylan-Kolchin 2018), it is likely that other precursor systems will be caught at similar phases to GN-z11 especially among UV-selected samples (and initial searches for such objects have already revealed other reionization era candidates; Isobe et al. 2023b; Marques-Chaves et al. 2024), enabling more detailed investigation of the timescales and processes involved in building up their stellar mass and peculiar abundances. The possible presence of an accreting black hole in GN-z11 (Maiolino et al. 2024, see Section 3.3) also hints at the potential importance of such dense highly clustered star-forming environments for seeding and growing massive black holes (e.g., Portegies Zwart & McMillan 2002), and the significance of constraining these processes directly at z > 6. Statistics of deep UV spectra of larger samples of systems to be collected with JWST promise to provide powerful insight into the formation conditions of globular clusters and other primordial structures complementary to the picture assembled from local stellar archeology.
Acknowledgments
The authors acknowledge helpful conversations with Andrew McWilliam, Josh Simon, and Ylva Götberg during the drafting of this manuscript. P.S. was generously supported by a Carnegie Fellowship through the Carnegie Observatories while conducting this work. B.L.J. is thankful for support from the European Space Agency (ESA).
This research made use of Astropy, a community-developed core Python package for Astronomy (Astropy Collaboration et al. 2013); Matplotlib (Hunter 2007); NumPy and SciPy (Harris et al. 2020; Virtanen et al. 2020); the SIMBAD database, operated at CDS, Strasbourg, France, and NASA's Astrophysics Data System.
Appendix A: On the Excess Quantity of Nitrogen
A simplified order-of-magnitude calculation can provide guidance as to the amount of nitrogen enrichment necessary to explain the N/O enhancement in GN-z11. We follow the same approach as Brinchmann et al. (2008b) to estimate the total mass of excess nitrogen in the system. First, we calculate the total mass of ionized hydrogen under a simple Case B Strömgren sphere via
where mp is the proton mass, T4 = Te /104 K, and Te and ne are the electron temperature and density (Draine 2011). For GN-z11, we calculate LHβ by first adopting the Hγ flux in the grating spectrum reported by B23: 13.9 × 10⁻¹⁹erg s−1 cm−2. Converting to Hβ luminosity per the Planck 2018 cosmology (Planck Collaboration et al. 2020) and following the fiducial Case B recombination spectrum at Te = 104 K and ne = 103 cm−3 (Draine 2011), we adopt LHβ = 4.6 × 1042 erg s−1. Adopting these same assumed ne and Te , we estimate a corresponding mass of ionized hydrogen of 3 × 10⁷ M⊙. Then, defining Δ(N/H) as the excess in the nitrogen (number) abundance over that expected for the galaxy, we can write the excess mass in nitrogen as
where mN/mH ≃ 14 represents the average ratio of the masses of the nitrogen and hydrogen ions.
At the gas-phase oxygen abundance of  estimated in Section 3, the expected N/H based upon the locus of local SDSS galaxies is
  and thereby
  The required boost in the gas-phase nitrogen to reach our inferred
  leads us to
  . Thus, we require a Δ(N/H) ≃ 2.4 × 10⁻⁵ in the gas phase. Plugging this into the above, we thus find a total mass of nitrogen required of 1 × 10⁴
M⊙.
. Thus, we require a Δ(N/H) ≃ 2.4 × 10⁻⁵ in the gas phase. Plugging this into the above, we thus find a total mass of nitrogen required of 1 × 10⁴
M⊙.
As a rough check on the plausibility of this value, we compare it to an order-of-magnitude calculation of the number of massive stars present in the galaxy. First, assuming that the Balmer line luminosity is dominated by O-stars and assuming L(Hβ) = 5 × 1036 erg s−1 for an O7V star, we very approximately estimate a total number of 106 O-stars. Following the canonical line of reasoning adopting a large but plausible binary influenced W-R/O ratio at this metallicity of 0.05 (Eldridge et al. 2017), we thus estimate a mass of nitrogen per W-R star of 0.2 M⊙. This is large, but encompassed by the range of values inferred in a similar manner in SDSS galaxies by Brinchmann et al. (2008a), and within an order of magnitude of the total mass of nitrogen ejecta implied by observations of Galactic W-R ring nebulae (Esteban et al. 1992). Alternatively, it is not unreasonable to suggest that with an open cluster interacting binary fraction of >70% (e.g., Sana et al. 2012), and dynamical interactions in a dense cluster potentially elevating both this fraction and the incidence of extreme interactions ejecting CNO-processed material (e.g., de Mink et al. 2009), a relatively prosaic nitrogen mass per interaction as low as <0.1 M⊙ may be sufficient.
Appendix B: beagle Line Fitting
For completeness, in this appendix, we record several details of the line fitting process with BEAGLE and summarize them in Section 3. Table B1 contains the actual line fluxes used in the BEAGLE fit. These values are taken from B23 (their Table 1). We specifically use the higher-resolution grating measurements, except for [O iii] λ4363, which was not detected in the grating; we apply a correction to this line using Hδ to convert the flux from the prism to grating. We present a comparison of these fit line fluxes with the model predictions in Figure B1. We also include several supplementary panels highlighting comparisons of our photoionization models to additional observed line ratios in Figure B2.
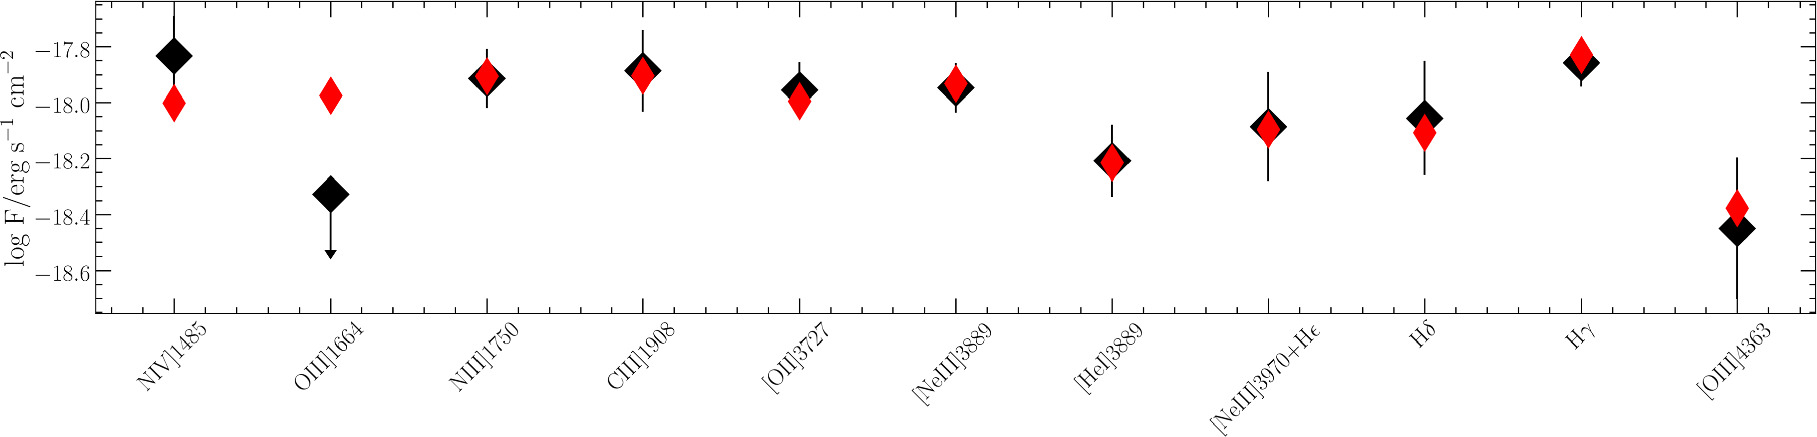
Figure B1. Comparison of observed and modeled emission-line fluxes. The black diamonds represent the data and the red diamonds are the fluxes predicted with BEAGLE for the best-fit model.
Download figure:
Standard image High-resolution image
Figure B2. Selected photoionization models compared to line ratios of GN-z11 (cross) and Mrk 996 (diamond), highlighting line ratios with [O ii] and C iii]. In the left panel, we compare the same set of starting models as in Figure 2 panel (c) in  ([O ii] λ3727/[Ne iii] λ3868) vs.
  ([O ii
λ3727/H δ), and show the impact of increasing nH from 102 to 106 cm−3. This increase in density suppresses [O ii] strongly due to the low critical densities of the upper states of this doublet, suggesting that some of the gas emission we observe is from a lower-density phase. In the right panel, we compare the same grids of photoionization models as in Figure 2 panels (a) and (b) in
([O ii
λ3727/H δ), and show the impact of increasing nH from 102 to 106 cm−3. This increase in density suppresses [O ii] strongly due to the low critical densities of the upper states of this doublet, suggesting that some of the gas emission we observe is from a lower-density phase. In the right panel, we compare the same grids of photoionization models as in Figure 2 panels (a) and (b) in  (N iii] λ1750/O iii] λ1664) vs.
  (N iii] λ1750/ C iii] λ1908). None of the ionizing sources considered can match either ratio with N iii], further suggesting an enhancement in N over both O and C is present.
Download figure:
Standard image High-resolution image
Table B1. Emission-line Fluxes used in BEAGLE Fitting for GN-z11
| Line | Flux (×10−19erg. s−1. cm−2) |
|---|---|
| N iv] λ1485 | 14.7 ± 2.1 |
| O iii] λ1664 | <;;;4.7 |
| N iii] λ1750 | 12.2 ± 1.3 |
| C iii] λ1908 | 13.0 ± 1.9 |
| [O ii] λ3727 | 11.1 ± 1.1 |
| [Ne iii] λ3868 | 11.3 ± 1.0 |
| [He i] λ3889 | 6.2 ± 0.8 |
| [Ne iii] λ3970 + H
| 8.2 ± 1.6 |
| Hδ | 8.8 ± 1.8 |
| Hγ | 13.9 ± 1.2 |
| [O iii] λ4363 | 3.55 ± 0.9 |
| Intercombination line ratios (not included in fit) | |
| [N iv] λ1483/N iv] λ1486 | <0.48 (99%) |
| [C iii] λ1907/C iii] λ1909 |

|
Download table as: ASCIITypeset image
Footnotes
- 8
We note that other solar abundance determinations (for instance, Magg et al. 2022) differ in reference CNO abundances by ≲0.1 dex and would likely have minimal impact on the key results presented here.
- 9
Using WebPlotDigitizer v4.6 (automeris.io/WebPlotDigitizer)
- 10
- 11
Maiolino et al. (2024) argue based upon a higher-S/N spectrum of N iii] in GN-z11 that the prominence of the high-ne,crit 1752.2 component suggests the possibility of even higher gas densities of ≳109 cm−3 in the N iii]-emitting gas.
- 12
As for C iii], we consider the summed flux of O iii] λ λ1661, 1666 in the fit, and denote this as λ1664.